Figures 11 & 12 Garcia River Temperature Charts
|
|
|
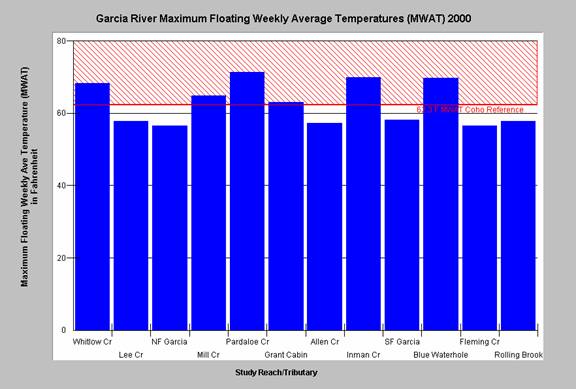
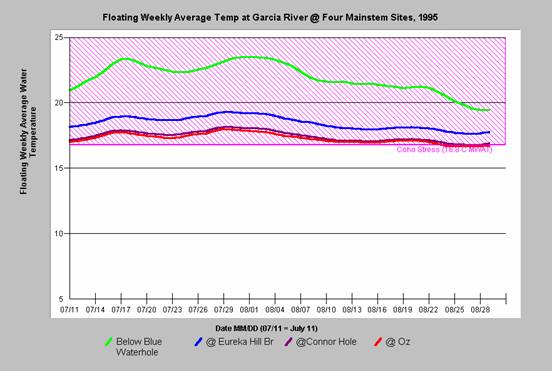
| Figure 11. Maximum floating weekly average water temperature at twelve Garcia River locations. From Maahs and Barber (2001) Table 15. Click to enlarge. [32 kb] | Figure 12. The floating weekly average temperature of the mainstem Garcia River below Blue Waterhole Creek is highly stressful for salmonids but the river cools to Oz where it is optimal for steelhead but too warm for coho Click to enlarge. [32 kb] |