About the Thermal Infrared Images
The thermal infrared images were collected as part of the Klamath River Basin Pilot Project and were used to develop broad scale temperature patterns in the basin. The images were collected using a helicopter mounted thermal infrared (TIR) radiometer (also know as FLIR). The radiometer was co-located with a day TV video camera in a gyro-stabilized gimbal mount and images were collected by flying longitudinally over the center of the stream channel at approximately 2000 ft above ground level. The TIR images were tagged with position information from a global positioning system (GPS) and recorded directly to an on-board computer. The imagery from the Day TV camera was also tagged with GPS positions and recorded to a video cassette recorder on the helicopter. The Klamath Basin survey started at Hamburg (downstream of the Scott River confluence) and concluded just past the I-5 crossing. The thermal survey was conducted on July 27,1998 and covered approximately 80 river kilometers.
The radiometer measures the thermal infrared energy emitted from the water's surface as well as other objects in the scene. The measured energy is converted to temperature by knowing the conditions under which the images were collected and the emissivity of water. As a result, each pixel in the image represents the radiant temperature at that location. To verify the accuracy of the radiant temperatures, four in-stream (Onset Stowaway) temperature loggers were placed in the river during the survey. Two in-stream loggers were placed near the beginning of the survey and two near the end. The radiant temperatures were very consistent (+/- 0.4 deg C) with the temperatures from the in-stream recorders.
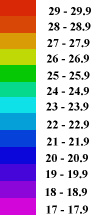
The median water temperature was sampled from the imagery and entered directly into the geographic information system (GIS).. The thermal images were then color coded and converted into a standard image format (graphics interchange file or gif). The water temperatures were colored in 1 degree increments throughout the observed temperature range of the river (17 - 30 deg C). Temperatures above 30 degrees C are displayed in grey scale where darker tones = cooler temperatures and lighter tones = warmer temperatures. The maximum temperature displayed is 50 degrees C.
Examples of the thermal images are shown below. The images for the survey are included on this CD-ROM and can be accessed directly through the ArcView GIS project.
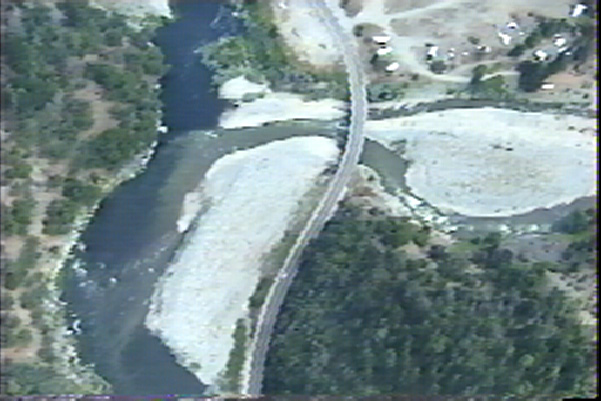
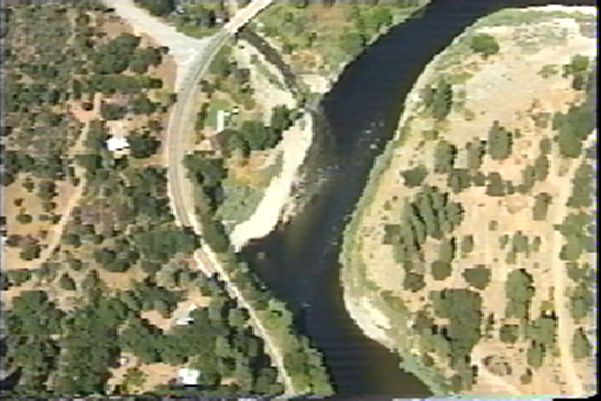
Day TV and thermal image pair showing the confluence of the Klamath River (flowing from the top to bottom of the image) and the Scott River (flowing in from the left). The key on the right shows the temperatures associated with the colors in the thermal image. As shown, the Klamath River is between 26 - 27 degrees C before the confluence with the Scott River. In most cases, terrestrial features show up in shades of grey with the vegetation in darker tones and the bare ground and paved road in lighter tones. Features such as moist vegetation and shaded areas are often at or below water temperatures and are colored in the image.
Day TV image/Thermal Image
Day TV and Thermal Image Pair showing the confluence of the Klamath River (flowing from the top of the image to the bottom of the image) and the Shasta River (flowing right to left in the image). The Shasta River is approximately 29 degrees C (!) and a warm water plume is observed into the Klamath River. The rock outcropping on the right side of the image shows temperature differences due to variations in sun exposure angles.
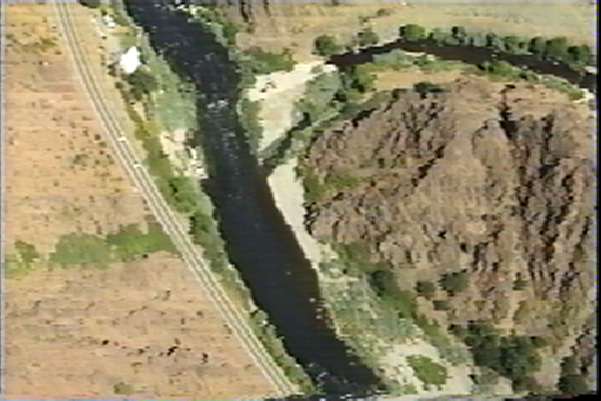
Day TV Image/Thermal Image
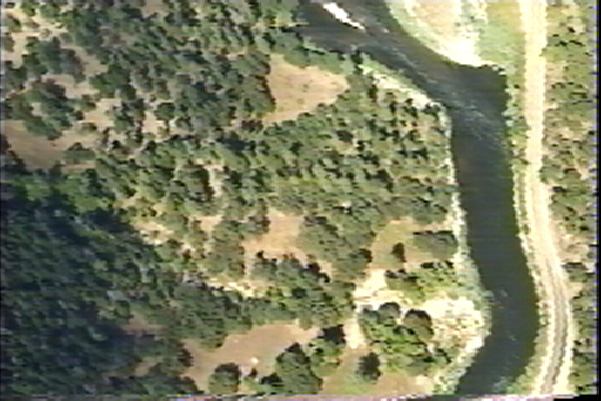
Day TV and Thermal IR image pair showing the confluence of the Klamath River with Beaver Creek. Beaver Creak is approximately 2 - 3 degrees C cooler then the river at the points. The thermal imagery provides a means to identify cold and warm water inflows and their absolute water temperatures at the time of the survey. These areas often indicate areas of thermal refugia that are used by cold water fish species during the summer months.
Day TV Image/Thermal Image
Day TV and Thermal IR Image Pair showing the Klamath River (flowing from the top to bottom of the image) and Sambo Gulch (flowing left to right in the image). Smaller tributaries and surface water that are not easily detected in the day TV video are often easily detected in the thermal imagery due to the large thermal contrast between the water and the surrounding terrain.
Day TV Image/Thermal Image