| Area | Petaluma River |
| Topic | Climate: Monthly Min, Avg, and Max Rainfall at Petaluma Fire Station |
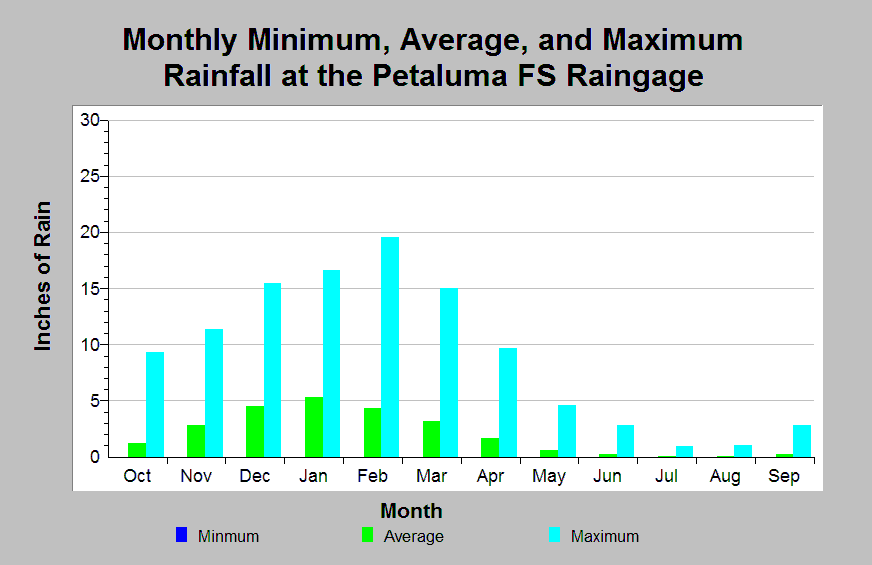
| Caption: This chart shows the monthly minimum, average, and maximum rainfall recorded at the Petaluma Fire Station raingage (DWR # E20 6826 00). Rainfall is highly seasonal, accumulating the most rainfall between October through April. On average, January is the wettest month (5.3 inches) and July is the driest (0.0 inches). The reported rainfall data are point measurements and do not represent the spatial variations existing throughout the entire Calwater planning watershed. See Info Links for more information. | |
 |
To learn more about this topic click Info Links .
To view additional information (data source, aquisition date etc.) about this page, click Metadata .
To view the table with the chart's data, click Chart Table web page.
To download the table with the chart's data, click climate_rainfall_monthly_ave_petaluma_fs.dbf (size 606 bytes)
To download the table with the chart's data as an Excel spreadsheet, click climate_rainfall_monthly_ave_petaluma_fs.dbf.xls (size 4,096 bytes) .
| www.krisweb.com |
