
| Area | Sonoma Creek |
| Topic | Sediment: Turbidity Frequencies <100 NTUs in Sonoma Creek 2001-2002 |
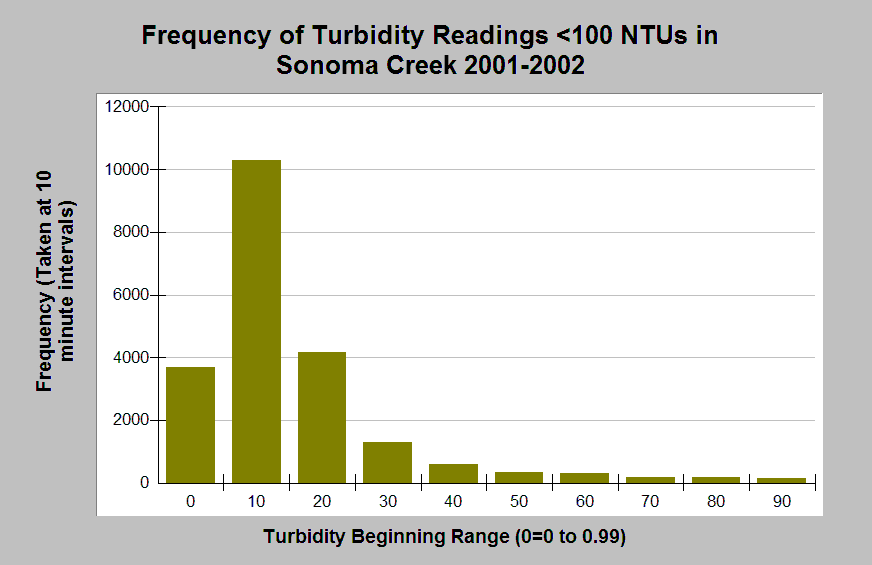
| Caption: The Chart displays the frequency of turbidity readings <100 NTUs at the Eldridge Station on Sonoma Creek in 2001 and 2002. This dataset is taken from the larger set of all turbidity frequencies, where the majority of readings fell between 0 and 100 NTUs. The largest number of values fell in the 10 to 19.99 NTU bin (10,297 readings, or 1,716 hours, in that range). Turbidity readings >25 NTUs have been shown to impair salmonid feeding (Siegler et al. 1984). Data provided by the Sonoma Ecology Center. Click Info Links for more information. | |
 |
To learn more about this topic click Info Links .
To view additional information (data source, aquisition date etc.) about this page, click Metadata .
To view the table with the chart's data, click Chart Table web page.
To download the table with the chart's data, click turbidity_freq_low01_02.xls.db (size 4,096 bytes)
To download the table with the chart's data as an Excel spreadsheet, click turbidity_freq_low01_02.xls.db.xls (size 4,096 bytes) .
| www.krisweb.com |