
| Area | Americano Creek |
| Topic | WQ: PH in Americano Creek/Estero Americano 1988-1990 |
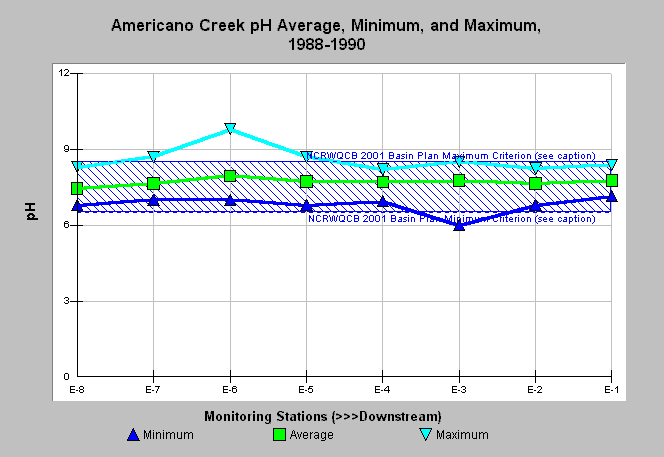
| Caption: The graph shows average, minimum, and maximum pH measured in Americano Creek, and its estuary, Estero Americano, during 1988-1990. Sampling occurred generally monthly, with the number of pH measurements at each station ranging from 15 to 27 samples for the monitoring period. Note that Stations E-1 through E-5 are estuarine. The reference values represent the North Coast Regional Water Quality Control Board (NCRWQCB) 2001 Basin Plan pH range objective of 6.5-8.5 (CRWQCB, 2001). This monitoring was part of a water quality study of Americano and Stemple Creeks by Merritt Smith Consulting for the City of Santa Rosa and U.S. Army Corps of Engineers. See Picture for a map of the sampling locations and Info Links for more details. | |
 |
To learn more about this topic click Info Links .
To view additional information (data source, aquisition date etc.) about this page, click Metadata .
To view the table with the chart's data, click Chart Table web page.
To download the table with the chart's data, click wq_americano_msc_phbyst_1988_1994.xls.db (size 4,096 bytes) .
To view the table with the chart's source data, click Source Table web page.
To download the table with the chart's source data, click wq_americano_msc_1988_1994.xls.db (size 96,256 bytes)
| www.krisweb.com |