| Area | Lagunitas Creek |
| Topic | Climate: Bear Valley HQ Rainfall Max Consecutive Hours 1975-1998 |
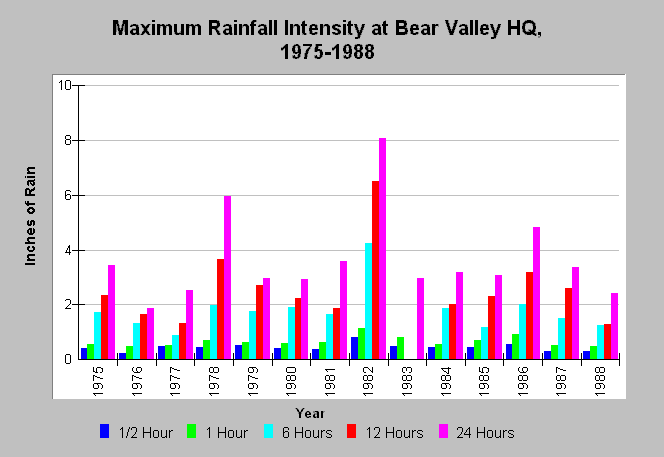
| Caption: The graph indicates rainfall intensity by showing the maximum rainfall in inches for an indicated number of consecutive hours (1/2 hour, 1 hour, 6 hours, 12 hours, and 24 hours) at the Bear Valley Headquarters of the Point Reyes National Seashore (PORE) from 1975-1988. The highest rainfall for 24 hours was just over 8 inches in 1982. Data were collected by PORE. See Map for location of sampling site and Info Links for more information. | |
 |
To learn more about this topic click Info Links .
To view additional information (data source, aquisition date etc.) about this page, click Metadata .
To view the table with the chart's data, click Chart Table web page.
To download the table with the chart's data, click climate_rainconsmin_bvy_nps.dbf (size 1,944 bytes) .
| www.krisweb.com |
