
| Area | Lagunitas Creek |
| Topic | Temperature: Lagunitas Cr Floating Weekly Ave @ SPT St Park 1997-2002 |
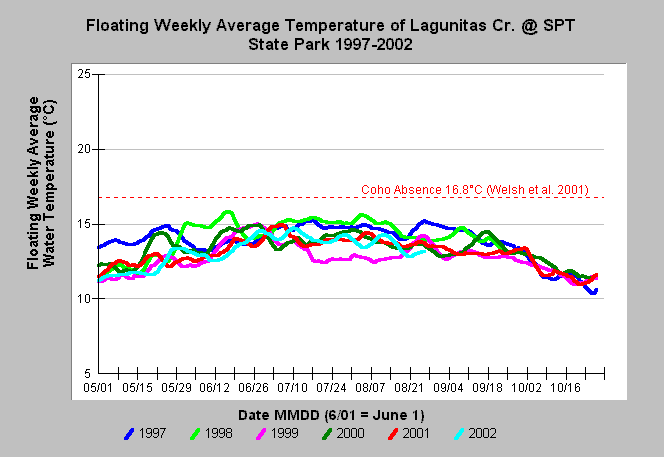
| Caption: The chart shows floating weekly average water temperatures at Lagunitas Creek at Samuel P. Taylor State Park for the years 1997-2002. Maximum floating weekly average water temperatures (MWAT) did not exceed 16.8°C during any year measured. Welsh et al. (2001) found that coho are not likely to persist where maximum floating weekly average temperature (MWAT) exceeds 16.8°C. The California State Water Resources Control Board has mandated that the mean daily water temperature at this site be maintained at 58 °F (14.4 °C) or less between May 1 and October 31 and 56 °F (13.3 °C) or less between November 1 and April 30 (CSWRCB, 1995). See Info Links for more information. Data were collected by Marin Municipal Water District. Click Map to see a map of temperature monitoring locations. | |
 |
To learn more about this topic click Info Links .
To view additional information (data source, aquisition date etc.) about this page, click Metadata .
To view the table with the chart's data, click Chart Table web page.
To download the table with the chart's data, click temp_mmwd_97_02_daily.db (size 679,936 bytes) .
To view the table with the chart's source data, click Source Table web page.
To download the table with the chart's source data, click tempraw_mmwd_97_02.dbf (size 13,604,076 bytes)
| www.krisweb.com |