| Area | Lagunitas Creek |
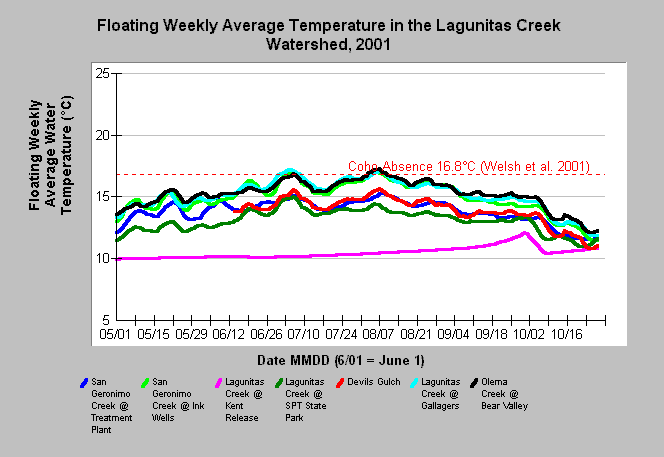
| Topic | Temperature: Lagunitas Cr Floating Wkly Ave @ Several Sites 2001 |
| Caption: The chart shows floating weekly average water temperatures at six sites in the Lagunitas Creek watershed for the year 2001. Welsh et al. (2001) found that coho are not likely to persist where maximum floating weekly average temperature (MWAT) exceeds 16.8°C. See Info Links for more information. Data were collected by Marin Municipal Water District. Click Map to see a map of temperature monitoring locations. | |
 |
To learn more about this topic click Info Links .
To view additional information (data source, aquisition date etc.) about this page, click Metadata .
To view the table with the chart's data, click Chart Table web page.
To download the table with the chart's data, click temp_mmwd_97_02_daily.db (size 679,936 bytes) .
To view the table with the chart's source data, click Source Table web page.
To download the table with the chart's source data, click tempraw_mmwd_97_02.dbf (size 13,604,076 bytes)
| www.krisweb.com |
