
| Area | Lagunitas Creek |
| Topic | WQ: Fecal Coliform in Lagunitas Creek Small Tribs 1999-2001 |
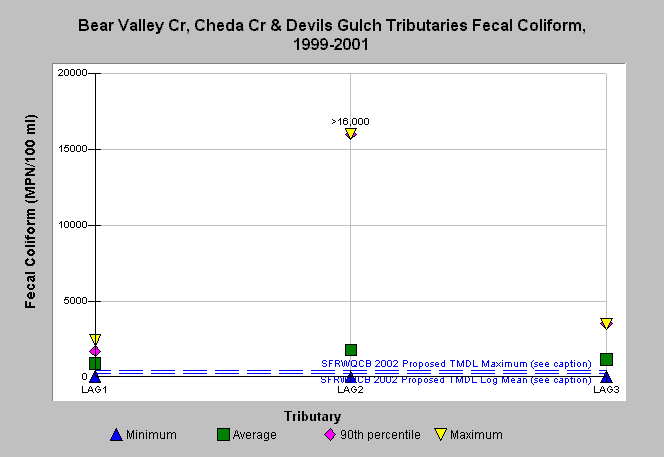
| Caption: Water quality parameters were measured by Point Reyes National Seashore in small tributaries of Lagunitas Creek, as well as a large tributary, Olema Creek and tributaries on the Point Reyes peninsula running into Drake's Bay and the Pacific Ocean from 1999-2001. The graph above shows fecal coliform data for Bear Valley (LAG1), Cheda Creek (LAG2), and Devils Gulch (LAG3), small tributaries of Lagunitas Creek. The proposed San Francisco Bay Regional Water Quality Control Board (SFRWQCB) Total Maximum Daily Loads (TMDLs) for fecal coliform are median <14 MPN/100 ml for Tomales Bay and log mean <200 MPN/100 ml for its tributaries based on a minimum of no less than five samples equally spaced over a 30-day period. The proposed maximum values are 43 and 400 MPN/100 ml for Tomales Bay and its tributaries, respectively, with no more than 10% of total samples during any 30-day period exceeding these numbers (CRWQCB, 2002). Note that the maximum and 90th percentile data are actually greater than 16,000 MPN/100 ml on Cheda Creek. See the Map Tab for location of water quality stations and see Info Links for more information. | |
 |
To learn more about this topic click Info Links .
To view additional information (data source, aquisition date etc.) about this page, click Metadata .
To view the table with the chart's data, click Chart Table web page.
To download the table with the chart's data, click wq_lag_avgmaxmin_pore_1999_2001.db (size 4,096 bytes) .
To view the table with the chart's source data, click Source Table web page.
To download the table with the chart's source data, click wq_all_avgmaxmin_pore_1999_2001.xls.db (size 14,336 bytes)
| www.krisweb.com |