
| Area | Lagunitas Creek |
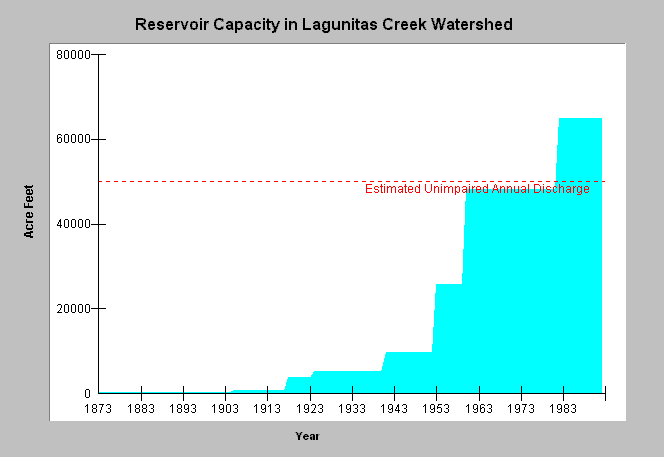
| Topic | Flow: Lagunitas Creek Watershed Reservoir Capacity 1872-1999 |
| Caption: This chart shows the cumulative impoundment capacity in the Lagunitas Creek watershed resulting from the construction or expansion of five dams beginning with Lagunitas Dam in 1873. Capacity was dramatically expanded in 1953 with the construction of Peters Dam (Kent Lake). Nicasio Dam, built in 1960, had the largest capacity until the expansion of Peters Dam in 1982. Overall capacity is 130% of average annual discharge. | |
 |
To learn more about this topic click Info Links .
To view additional information (data source, aquisition date etc.) about this page, click Metadata .
To view the table with the chart's data, click Chart Table web page.
To download the table with the chart's data, click flow_lag_impound.dbf (size 5,877 bytes) .
| www.krisweb.com |