| Area | Stemple Creek |
| Topic | Temperature: Stemple Creek 1990-2000 |
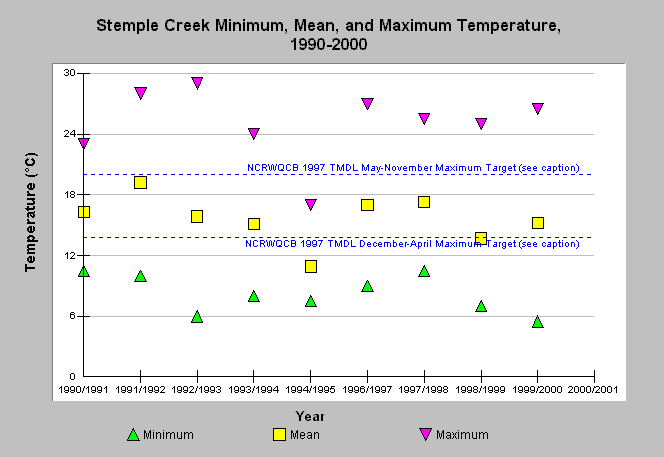
| Caption: This graph shows the yearly minimum, maximum, and average water temperatures at all locations in Stemple Creek from 1990-2000. Water quality parameters were measured in Stemple Creek by the California Department of Fish and Game. The reference values represent the maximum North Coast Regional Water Quality Control Board Stemple Creek TMDL thresholds to be met by 2004 from May-November (20°C) and December-April (13.8°C) at a specific freshwater and saline location (Salisbury, 1997). Maximum water temperatures exceeded those known to support salmonids in several years at least at some sites. See Map for sampling locations and Info Links for more information. | |
 |
To learn more about this topic click Info Links .
To view additional information (data source, aquisition date etc.) about this page, click Metadata .
To view the table with the chart's data, click Chart Table web page.
To download the table with the chart's data, click wq_stemple_cdfg_1990_2001.xls.db (size 6,144 bytes) .
To view the table with the chart's source data, click Source Table web page.
To download the table with the chart's source data, click wq_marinsonoma_cdfg_raw_1991_2002.xls.db (size 380,928 bytes)
| www.krisweb.com |
