| Area | S Marin/Redwood Creek |
| Topic | Fish: Redwood Creek Juvenile Salmonid Abundance (Fish/100ft) 1993 |
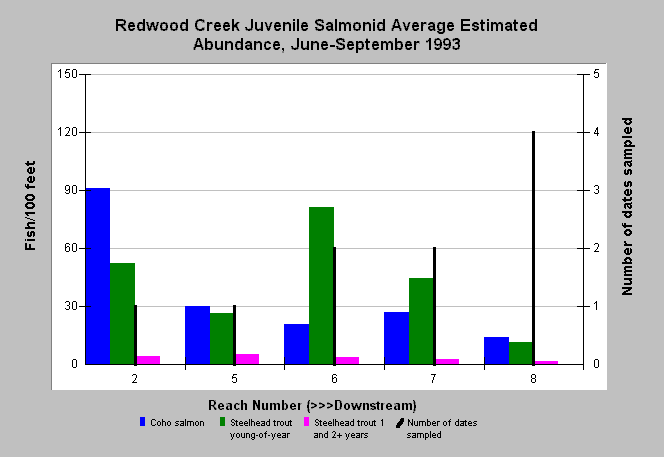
| Caption: This graph shows the average estimated number of juvenile salmonids per 100 meters from electrofishing results at several sites in Redwood Creek during the summer of 1993. Note that values for Site 8 are actual capture totals, not abundance. Sites 2 and 5 were only sampled once in June and August, respectively. However Sites 6 and 7 were sampled twice and Site 8 was sampled four times. Sampling at these sites occurred a couple months apart, generally from June through September. Coho were more numerous in upstream areas and many counted early in the season at lower stations did not survive into the fall due to depleted flows. Data were collected by Dr. Jerry J. Smith of San Jose State University for the California Department of Transportation, District IV and the Golden Gate National Recreation Area. See Picture for a map of the sampling sites and Info Links for more information. | |
 |
To learn more about this topic click Info Links .
To view additional information (data source, aquisition date etc.) about this page, click Metadata .
To view the table with the chart's data, click Chart Table web page.
To download the table with the chart's data, click fish_redwood_densitysum_smith_1993.xls.db (size 4,096 bytes) .
To view the table with the chart's source data, click Source Table web page.
To download the table with the chart's source data, click fish_redwood_smithsum_1992_2001.xls.db (size 16,384 bytes)
| www.krisweb.com |
