
| Area | S Marin/Redwood Creek |
| Topic | Temperature: Redwood Creek at Lower Min, Max, and Average 1995 |
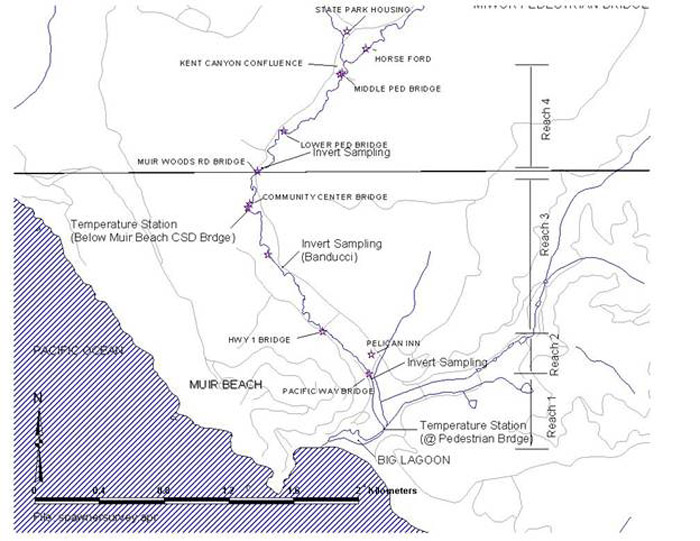
This map shows Reaches 1-4 (out of six, plus tributary Fern Creek) where Golden Gate National Recreation Area staff conducted a stream habitat and benthic macroinvertebrate inventory of Redwood Creek in 1995. See Picture #2 for Reaches 5-6. In addition, this map shows 1995 temperature monitoring stations on Redwood Creek above Big Lagoon (Lower) and below Muir Beach CSD Bridge (Middle). See Picture #2 for temperature monitoring station on Redwood Creek at Milepost 2.25 (Upper).
This map shows Reaches 5 and 6 (plus tributary Fern Creek) where Golden Gate National Recreation Area staff conducted a stream habitat and benthic macroinvertebrate inventory of Redwood Creek in 1995. See Picture #2 for Reaches 1-4. In addition, this map shows 1995 temperature monitoring station Redwood Creek at Milepost 2.25 (Upper). See Picture #2 for temperature monitoring stations on Redwood Creek above Big Lagoon (Lower) and below Muir Beach CSD Bridge (Middle).
 Click on image to enlarge (114K).
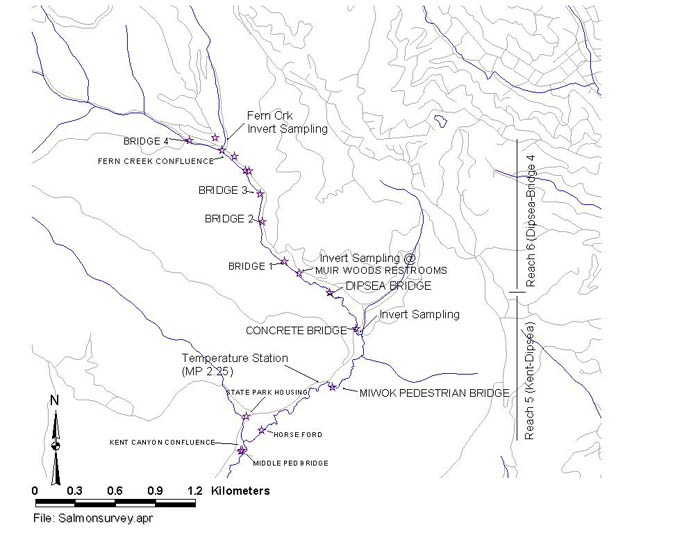 Click on image to enlarge (58K).
To learn more about this topic click Info Links
To view additional information (data source, aquisition date etc.) about this page, click Metadata
| www.krisweb.com |