
| Area | Salmon Creek |
| Topic | WQ: Conductivity in Salmon Creek 1996 |
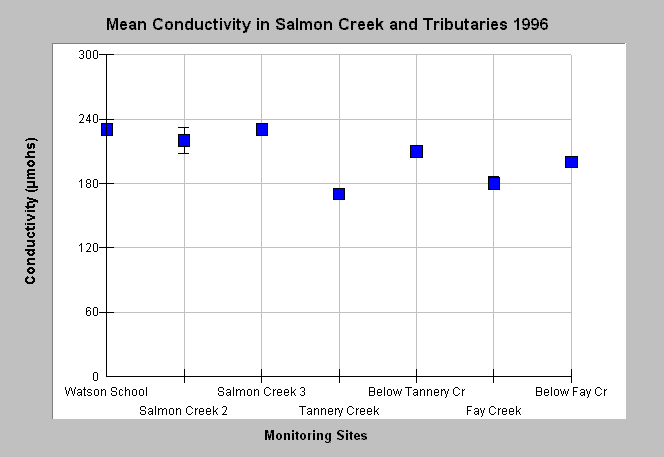
| Caption: Conductivity was measured at seven sites in the Salmon Creek watershed in 1996 by Bodega Marine Laboratory students. The graph shows the mean value (with standard deviation) at each site going downstream from left to right. Note that conductivity is lower in tributaries Fay Creek and Tannery Creek. See Picture for the location of study reaches and Info Links for more information. | |
 |
To learn more about this topic click Info Links .
To view additional information (data source, aquisition date etc.) about this page, click Metadata .
To view the table with the chart's data, click Chart Table web page.
To download the table with the chart's data, click wq_salmon_bml_1996.dbf (size 2,955 bytes) .
| www.krisweb.com |