| Area | Basinwide/Regional |
| Topic | WQ: Aluminum in Lower Chamberlain Creek, 1996-2000 (DHS) |
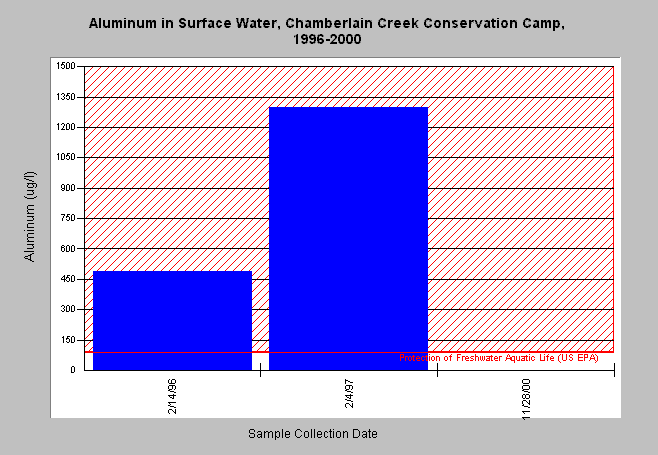
| Caption: This chart shows aluminum values in the CDF Chamberlain Creek Conservation Camp drinking water system. (Press F7 for easier caption viewing). This system draws surface water through a diversion of Chamberlain Creek. It is presumed that detections reported as zero (0) were not actually zero, but not detected at the detection limit for the given compound. It should also be noted that in many or all cases, these samples were collected by the operator of the water treatment/distribution system and sampling technique is not known. Generally, the samples are collected at the system intake to assess the quality of the source water prior to treatment. However, the actual location of the sampling point could significantly affect the results. Given the high levels of aluminum detected in two of the samples, it is suspected that these samples may have been collected after water treatment. In some cases, aluminum is used to treat drinking water and would affect aluminum results if added to water prior to sample collection. Water quality criteria are from the US EPA National Recommended Ambient Water Quality Criteria. This criterion is used to quantify the narrative Basin Plan beneficial use designation of COLD. The criteria given are expressed as a continuous 4-day average concentration that is protective of freshwater aquatic life. Value given as total recoverable aluminum in water samples with a pH of 6.5 to 9.0. Note that a large number of other compounds were sampled, but are not plotted here. The complete data set is available in the Source Table. Data provided by the California Department of Health Services. Click on the Info Links tab for more information. | |
 |
To learn more about this topic click here .
To view the table with the chart's data, click Chart Table web page.
To download the table with the chart's data, click wq_dhschart.dbf (size 12,545 bytes) .
To see meta information about the data table used for this topic click here
To view the table with the chart's source data, click Source Table web page.
To download the table with the chart's source data, click wq_dhs.dbf (size 314,346 bytes)
| www.krisweb.com |
