
| Area | Basinwide/Regional |
| Topic | Maps of Big River Basin - Geology and Land-Use |
The image above shows the location of roads as taken from US Geologic Survey topographic maps, although these maps are of 1:24000 scale they are very out of date and many more roads are present in the basin, mostly associated with logging.
The image above shows a map of geohazards for the Big River basin supplied by the California Division of Mines and Geology. Maps with active and dormant landslide features and earthquake faults are useful for understanding erosion risk during watershed assessment or when planning land use activities. Planning watersheds are outlined in yellow.
The image above shows the soil erodibility in the Big River basin according to a Natural Resource Conservation Service 1:24000 Mendocino County soil map. The erodibility rating is based on detachability of soil particles and slope steepness (kkfact). Planning watersheds are outlined in yellow.
The map image above shows the bedrock geology of the Big River basin provided by the California Division of Mines and Geology. Anomalies associated with grid lines were not explained by CDMG, but indicate that inland classifications were generalized. The western portion of the watershed is mostly uplifted marine sediment and sand dunes. The dominant formation in the central part of the watershed is Coastal Belt Franciscan. To the east the Central Belt Franciscan Formation intrudes into the Upper North Fork Big River, Martin Creek, and Rice Creek planning watersheds. Outlines and names of CalWater planning watersheds are shown in white.
The map image above shows an artificial 3D landscape with an overlay showing slope steepness, both constructed from the 10 meter DEM. Slope steepness is greatest in the North Fork and Upper Big River. Slopes are generally less steep in the South Fork basin, although some areas in a band running north-south through the Dark Gulch and Leonard Lake Calwater units and extending into eastern Daugherty Creek. Steep slopes in western sub-basins are largely related to the inner gorge area.
The image above is of the old railroad lines that were once used for timber hauling in Big River. They extend up the lower Big River to the Little North Fork and well into the forks of that drainage. Railroad tracks were also laid up Laguna Creek. Digitized from a map in the book Big River Was Dammed, by Francis Jackson. See history section for more reading on railroads and splash dams. See the next Picture for a location of splash dams.
The map above shows locations of logging splash dams in Big River which operated from the 1880's through the 1930's. Points were digitized by KRIS IFR from the book Big River Was Dammed, by Francis Jackson. See History Background pages for more historical information, or see Tours in this sub-basin of splash dams and their operation.
The image above comes from the KRIS Big River Map project and shows timber harvests as mapped by the California Department of Forestry by year from 1986-1999. The timber harvests shown above have been approved but may have not yet been implemented. Timber harvest in the last 15 years has been most intensive in the lower Big River, Upper Big River and Daugherty Creek. Planning watersheds are outlined in red.
 Click on image to enlarge (105K).
 Click on image to enlarge (99K).
 Click on image to enlarge (69K).
 Click on image to enlarge (53K).
 Click on image to enlarge (133K).
 Click on image to enlarge (325K).
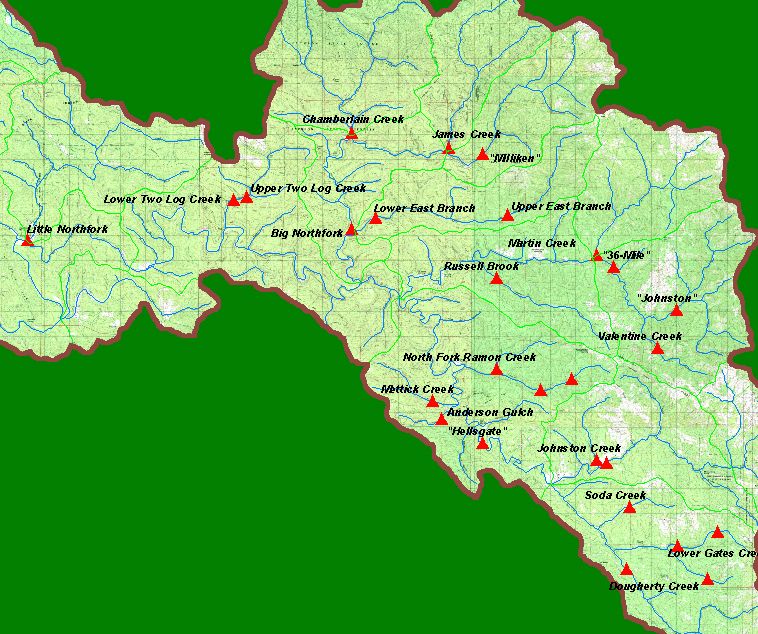 Click on image to enlarge (136K).
 Click on image to enlarge (65K).
To learn more about this topic click here
| www.krisweb.com |