| Area |
Basinwide/Regional |
| Topic |
Sediment: Matthews Suspended Sediment and Bedload Calculations |
 Click on image to enlarge (97K). Click here to display a larger version (158K).
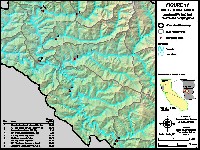
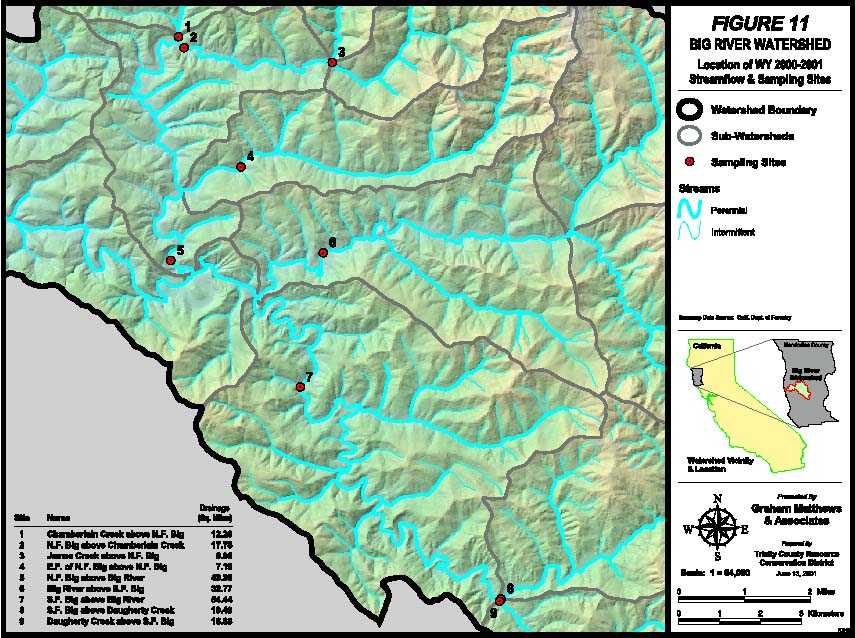
This figure is from Matthews and Associates (2001), showing stream flow and sediment sampling sites in the Big River basin.
 Click on image to enlarge (167K). Click here to display a larger version (294K).
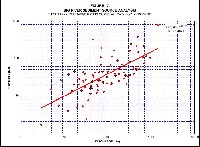
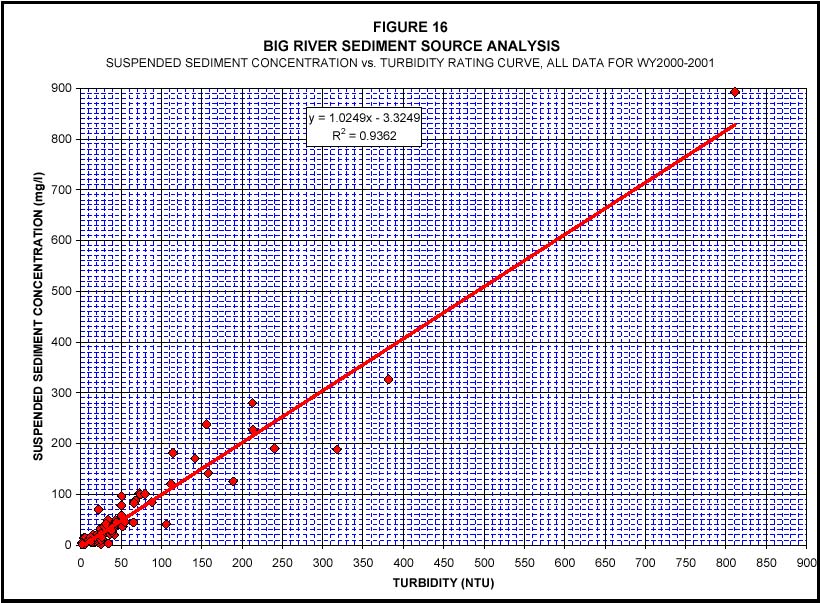
This figure, from Matthews and Associates (2001), relates suspended sediment and turbidity in the Big River basin.
 Click on image to enlarge (103K). Click here to display a larger version (180K).
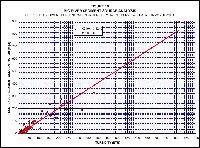
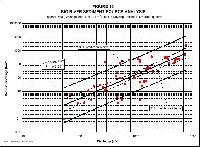
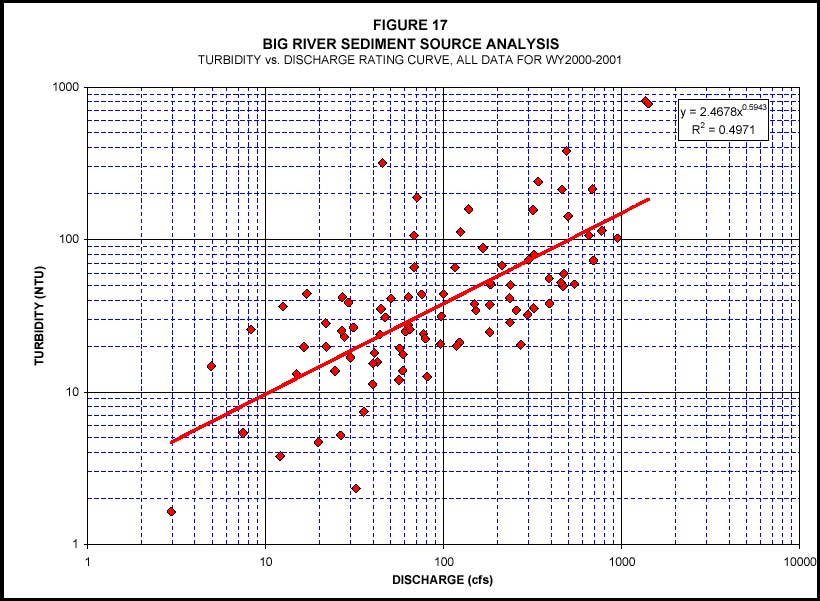
This figure, from Matthews and Associates (2001), relates turbidity to discharge in the Big River basin.
 Click on image to enlarge (144K). Click here to display a larger version (232K).
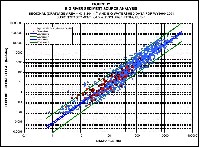
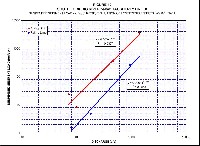
This figure is from Matthews and Associates (2001), showing the suspended sediment discharge relationship for Big River.
 Click on image to enlarge (101K). Click here to display a larger version (177K).
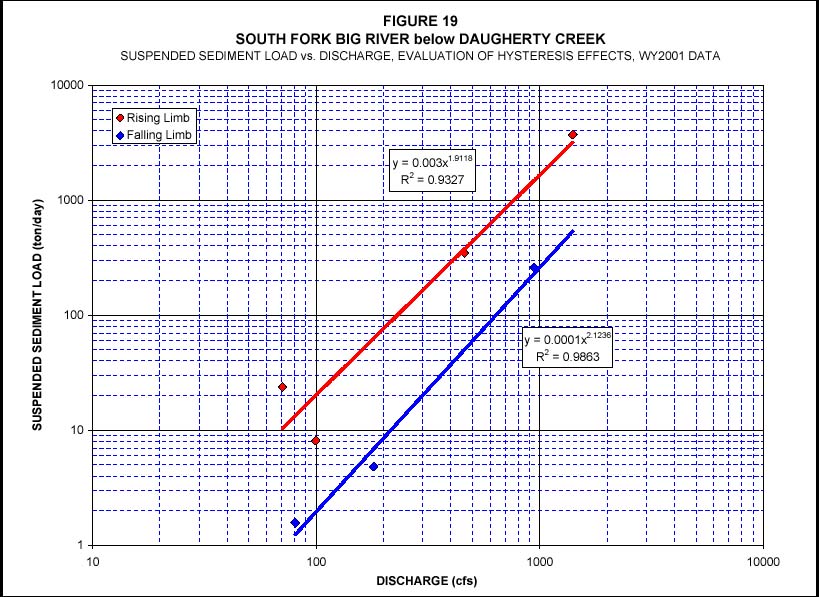
This figure, from Matthews and Associates (2001), shows the hysteresis effects of the suspended sediment and discharge relationship for a storm in the South Fork Big River.
 Click on image to enlarge (128K). Click here to display a larger version (202K).
This figure, from Matthews and Associates (2001), shows the bedload transport and flow relationship for Big River.
To learn more about this topic click here

 Click on image to enlarge (97K). Click here to display a larger version (158K).
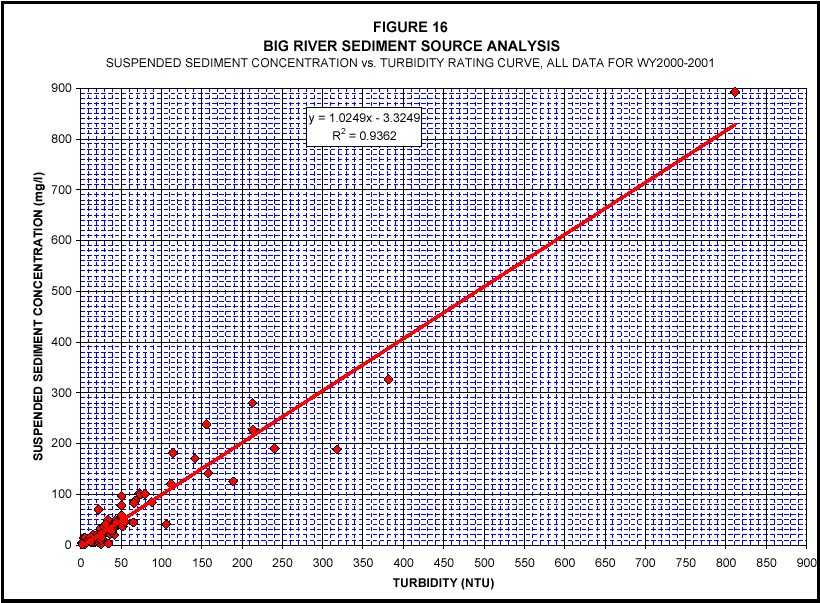 Click on image to enlarge (167K). Click here to display a larger version (294K).
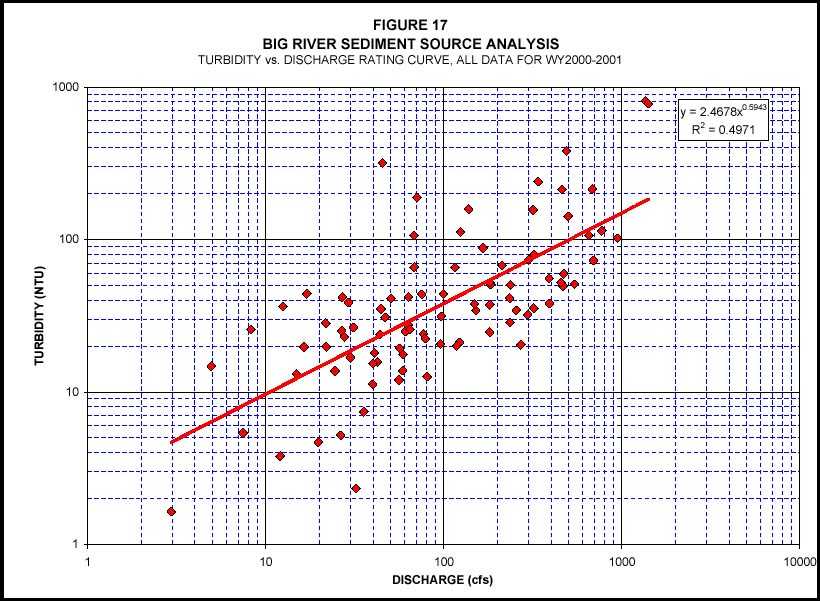 Click on image to enlarge (103K). Click here to display a larger version (180K).
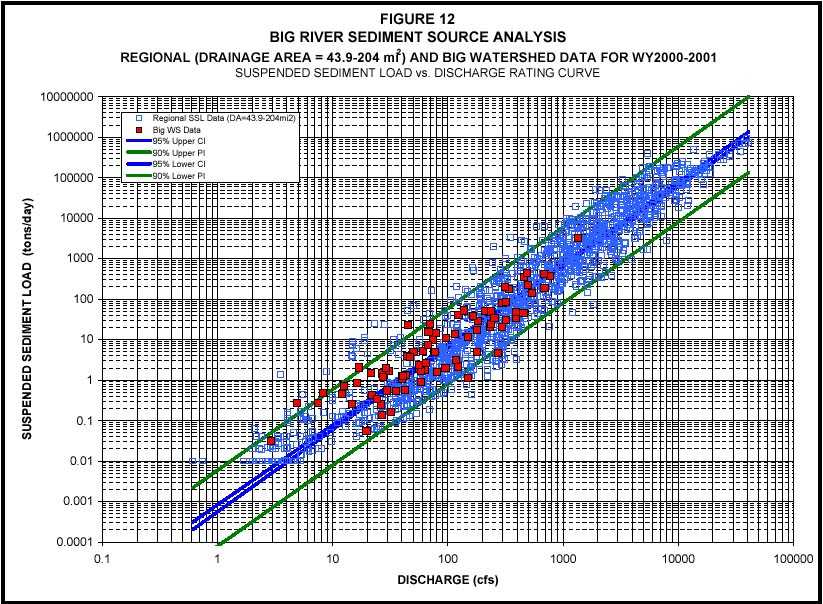 Click on image to enlarge (144K). Click here to display a larger version (232K).
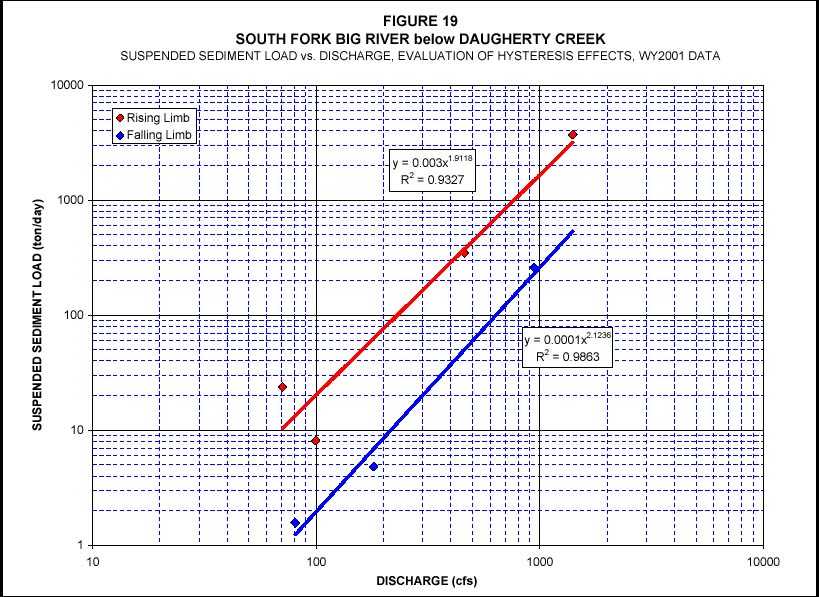 Click on image to enlarge (101K). Click here to display a larger version (177K).
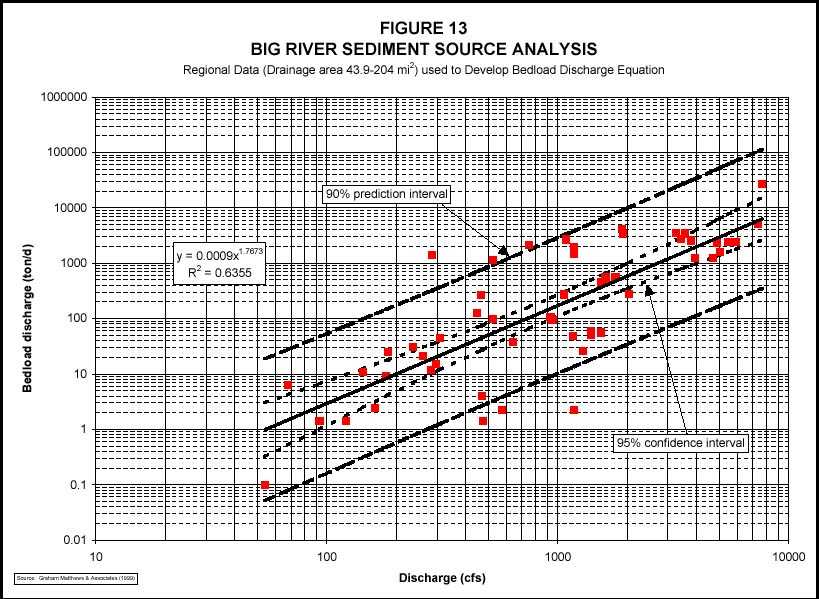 Click on image to enlarge (128K). Click here to display a larger version (202K).
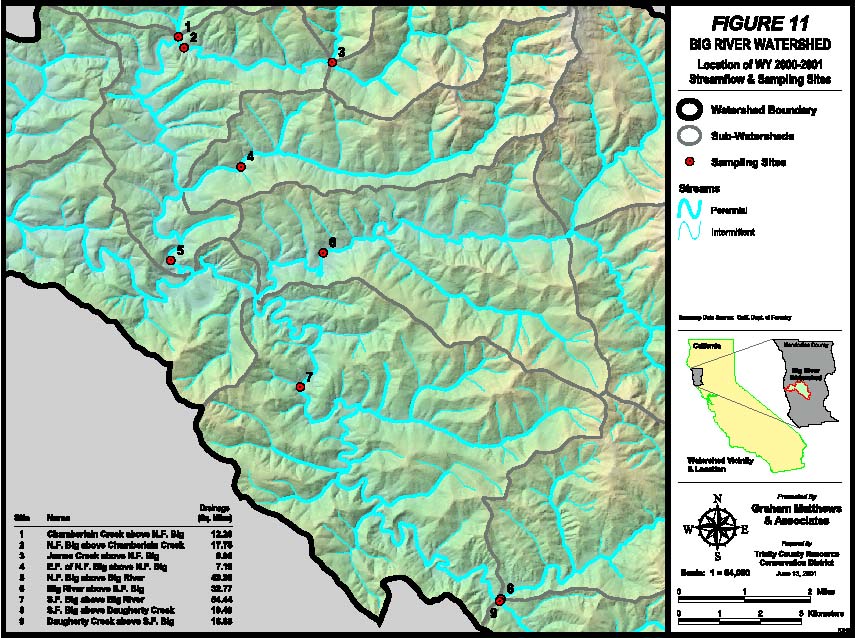