
| Area | Middle Big River |
| Topic | Temperature: Min, Max and Average (F), Lower Two Log Creek, 1998 |
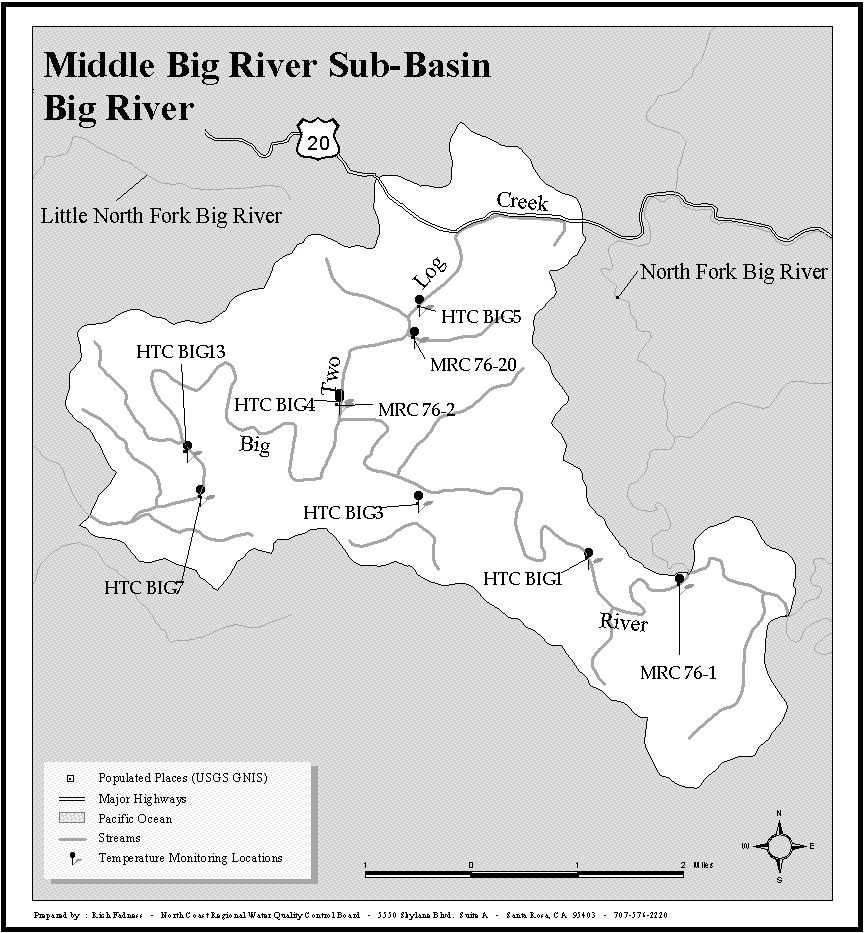
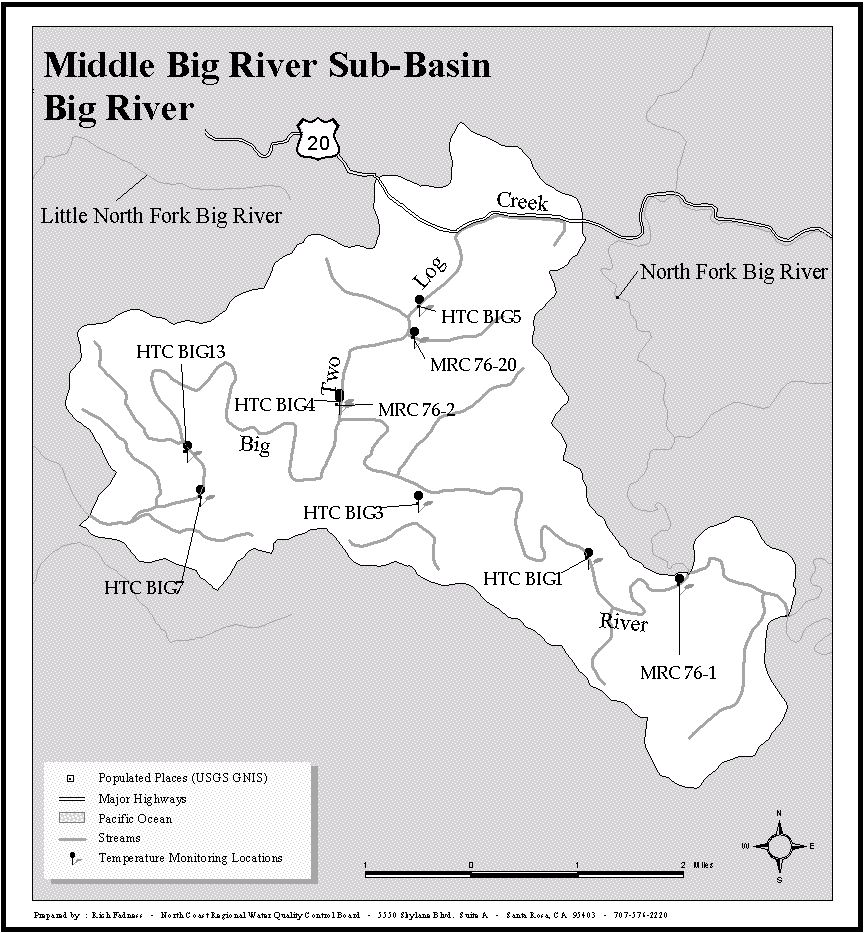
This map includes water temperature monitoring locations in the Middle Big River Sub-basin for all NCWAP data contributors. The boundaries of the sub-basin are described in the NCWAP assessment report for the Big River.
 Click on image to enlarge (116K). Click here to display a larger version (216K).
To learn more about this topic click here
www.krisweb.com