| Area | North Fork Big River |
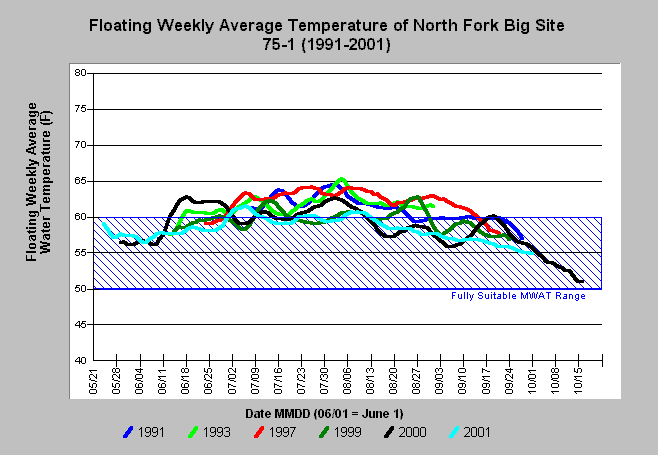
| Topic | Temperature: Floating Weekly Average, North Fork Big River, 1991-01 |
| Caption: The maximum floating weekly average water temperature, or MWAT, in the North Fork Big River sub-basin at site 75-1 exceeded the fully suitable range each year from 1991 to 2001 and is, therefore, unsuitable for coho salmon. The 60 degree F (15.6 C) stress threshold for coho salmon was chosen as a threshold for the North Coast Watershed Assessment Program based on literature review. Floating weekly average water temperatures mask transient peaks and the 50-60 F reference from NCWAP would be more appropriately applied to maximum daily readings. See Info Links for more information. Data provided by the Mendocino Redwoods Timber Company. Click on Picture for map of locations. | |
 |
To learn more about this topic click here .
To view the table with the chart's data, click Chart Table web page.
To download the table with the chart's data, click mrc_fwa.db (size 270,336 bytes) .
To see meta information about the data table used for this topic click here
To view the table with the chart's source data, click Source Table web page.
To download the table with the chart's source data, click mrc_temp.dbf (size 3,547,204 bytes)
| www.krisweb.com |
