
|
Area/Topic | Bibliography | Background | Hypotheses | Home |
|
Map Page.
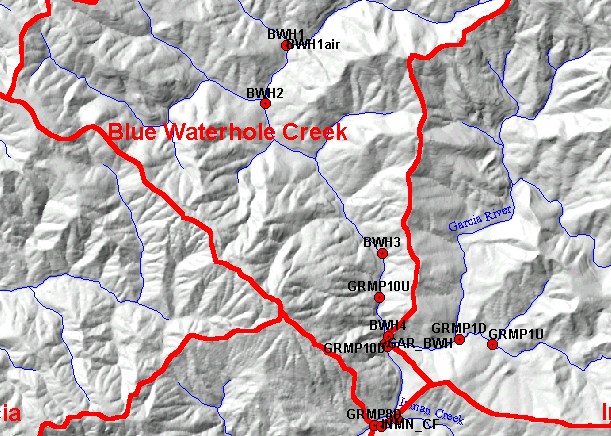
You selected the area Blue Waterhole Creek and the topic Temperature: FWA at Blue Waterhole Creek Site 1, 1993-2001 |
| This map shows temperature monitoring stations in the Blue Waterhole sub-basin, overlaid on top of USGS 1:24,000 scale streams, an elevation hillshade, and sub-basins. Temperature sites are color-coded by their floating weekly average temperature (MWAT). Coho are not usually found in streams where MWAT exceeds 16.8 °C (Welsh et. al, 2000). Data were contributed by the California Department of Forestry's Garcia River Instream Monitoring Project and Friends of the Garcia River. Click the check box next to a layer to toggle it on/off. Other available layers include a Topographic Map and Riparian Vegetation Size. Scale = 1:47,760 . | |||
|
|
||
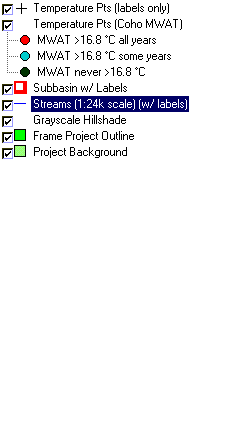
To view metadata about a map layer, click on a link in the table below.
| Name of Layer in Map Legend | Metadata File Name |
|---|---|
| Temperature Pts (labels only) | regional_monitorsites_gar.shp.txt |
| Temperature Pts (Coho MWAT) | regional_monitorsites_gar.shp.txt |
| Subbasin w/ Labels | subbasins.shp.txt |
| Streams (1:24k scale) (w/ labels) | streams24.shp.txt |
| USFS Riparian Veg Size (1994)(TIFF) | vegsizebuf.tif.txt |
| Topo Map (1:24k scale)(USGS) | Unavailable |
| Grayscale Hillshade | grayscale_light.tif.txt |
| Frame Project Outline | Unavailable |
| Project Background | Unavailable |
| www.krisweb.com |