
|
Area/Topic | Bibliography | Background | Hypotheses | Home |
|
Map Page.
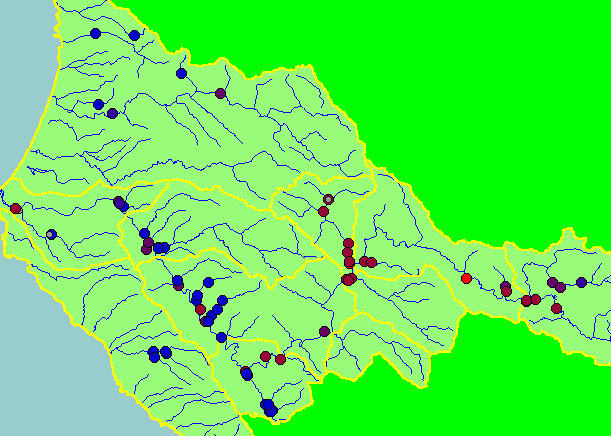
You selected the area Basin-wide/General and the topic Temperature: All Garcia Basin Sites, MWAT by Year 1994-2001 |
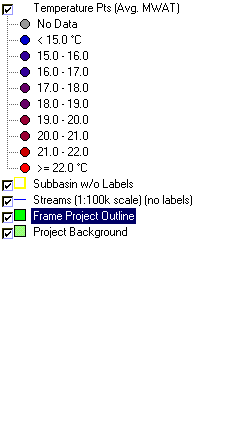
| This map shows temperature monitoring stations in the KRIS Garcia project area, overlaid on top of USGS 1:100,000 scale streams, and sub-basins. Temperature sites are color-coded by their floating weekly average temperature (MWAT). Coho are not usually found in streams where MWAT exceeds 16.8 °C (Welsh et. al, 2000). Data were contributed by Friends of the Garcia River, Mendocino County Water Agency, Mendocino Redwoods Company, Coastal Forestlands, and the California Department of Forestry's Garcia River Instream Monitoring Project. | |||
|
|
||
To view metadata about a map layer, click on a link in the table below.
| Name of Layer in Map Legend | Metadata File Name |
|---|---|
| Temperature Pts (Avg. MWAT) | regional_monitorsites_gar.shp.txt |
| Subbasin w/o Labels | subbasins.shp.txt |
| Streams (1:100k scale) (no labels) | streams100.shp.txt |
| USFS Riparian Veg Size (1994)(TIFF) | vegsizebuf.tif.txt |
| Topo Map (1:24k scale)(USGS) | Unavailable |
| Grayscale Hillshade | grayscale_light.tif.txt |
| Frame Project Outline | Unavailable |
| Project Background | Unavailable |
| www.krisweb.com |