
|
Area/Topic | Bibliography | Background | Hypotheses | Home |
|
Map Page.
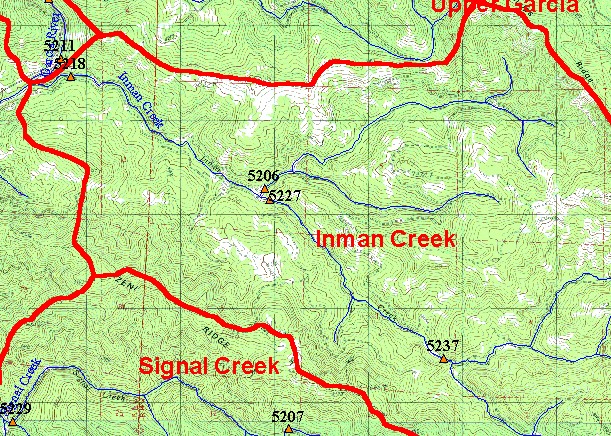
You selected the area Inman Creek and the topic Temperature: Min, Max, Avg at Inman Creek - lower, 1997 |
| This map shows some temperature monitoring stations in the Inman Creek sub-basin, overlaid on top of USGS 1:24,000 scale streams, a topographic map, and sub-basins. Temperature sites are color-coded by their floating weekly average temperature (MWAT). Coho are not usually found in streams where MWAT exceeds 16.8 °C (Welsh et. al, 2000). Data were contributed by the North Coast Regional Water Quality Control Board and Humboldt State University's Institute for Forest and Watershed Management. | |||
|
|
||
To view metadata about a map layer, click on a link in the table below.
| Name of Layer in Map Legend | Metadata File Name |
|---|---|
| Forest Science Project Temp Pts | n_coast_temps.shp.txt |
| Subbasin w/ Labels | subbasins.shp.txt |
| Streams (1:24k scale) (w/ labels) | streams24.shp.txt |
| USFS Riparian Veg Size (1994)(TIFF) | vegsizebuf.tif.txt |
| Topo Map (1:24k scale)(USGS) | Unavailable |
| Grayscale Hillshade | grayscale_light.tif.txt |
| Frame Project Outline | Unavailable |
| www.krisweb.com |