
| Area | Lower Garcia / Estuary |
| Topic | Climate: Annual Rainfall - Point Arena, 1949-1988 |
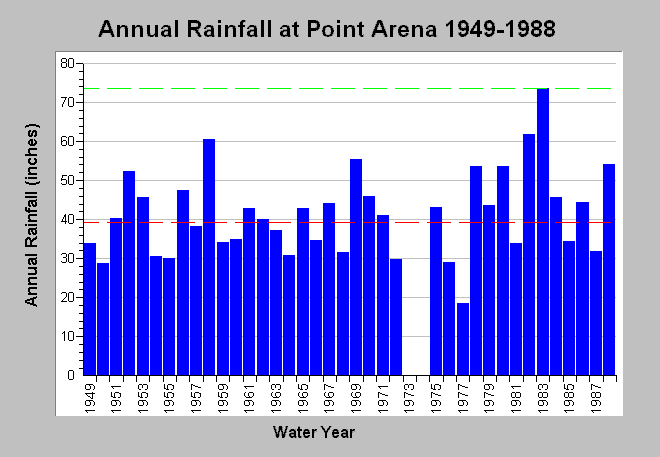
| Caption: This chart shows annual rainfall accumulation recorded at the Point Arena rain gage (DWR # F80 7009 00) between 1949 and 1988, missing water years 1973-1974. Rainfall measurements are by water year (Oct 1-Sept 30) and totals for the Point Arena gage are shown in this chart. For the period of record, the minimum total rainfall accumulation occurred in 1977 (18.46 inches) and the maximum during 1983 (73.54 inches). The latter is shown by a dashed green line while the mean of just less than 40 inches is in red. Data were provided by the California Department of Water Resources and James Goodridge. See InfoLinks for more information. | |
 |
To learn more about this topic click Info Links .
To view additional information (data source, aquisition date etc.) about this page, click Metadata .
To view the table with the chart's data, click Chart Table web page.
To download the table with the chart's data, click climate_rainfall_annual_pt_arena.dbf (size 898 bytes) .
| www.krisweb.com |