| Area | Mill/Pardaloe Creeks |
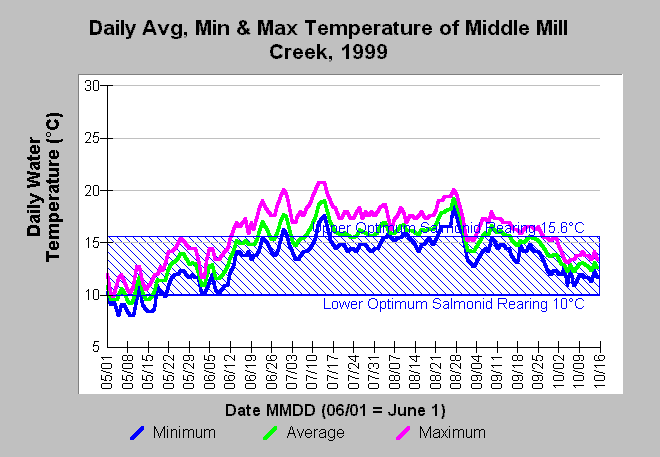
| Topic | Temperature: Min, Max, Avg at Mill Creek - middle, 1999 |
| Caption: This Chart shows the daily minimum, maximum and average water temperature in Celsius (°C) at middle Mill Creek (site GRIMP4D) for the year 1999. While daily maximum and average water temperatures were often above the optimum range for juvenile salmonids from mid-June to September 2001, temperatures often fell into the optimal range for at least some period of the day. The reference value of 10-15.6°C optimum temperature range for juvenile salmonid rearing is based on McCullough (1999). See InfoLinks for more information. Data were contributed by the California Department of Forestry's and Mendocino County RCD's Garcia River Instream Monitoring Project (Maahs and Barber, 2001). | |
 |
To learn more about this topic click Info Links .
To view additional information (data source, aquisition date etc.) about this page, click Metadata .
To view the table with the chart's data, click Chart Table web page.
To download the table with the chart's data, click temp_gar_grimp_99_daily.db (size 151,552 bytes) .
| www.krisweb.com |
