 |
 |
| Background | Hypotheses | Bibliography | Maps | Home |
|
|
| Background | Hypotheses | Bibliography | Maps | Home |
KRIS Gualala Map Project: Land
Cover View
![]()
The Land Cover View in the KRIS Gualala Map project provides a wealth of spatial data for watershed assessment such as vegetation stand conditions, road locations, period of construction and ownership. For establishing location and a sense of topography, this view has Gualala NCWAP study areas, Calwater watershed boundaries, a USGS topographic map, a digital elevation map, and a full coverage of digital orthophoto quads from 1996. The vegetation themes, derived from a 1994 Landsat image by the USFS Spatial Analysis Lab in Sacramento (Warbington et al., 1998), can be queried by tree size or by community type (see Vegetation Types). The California Department of Forestry Fire and Resource Assessment Program provided change scene detection, which compares a 1994 Landsat image with one captured in 1998 (Fisher, in press). The Environmental Protection Agency also produces a land use map based on the 1994 Landsat coverage, which has been assimilated into the KRIS Gualala Map project.
|
|
The image at left shows vegetation based on a 1994 Landsat image. The eastern part of the Gualala basin is underlain by Central Belt Franciscan terrain and is, therefore, naturally in grasslands, oak woodlands and mixed oak and coniferous forest. The Ohlsen Ranch Formation in the eastern portion of the upper South Fork also has similar vegetation patterns with non-forest conditions and saplings. The best coniferous timberland is in the lower South Fork and in the western portions of the Wheatfield, Buckeye, Rock pile and North Fork basins. Almost no Very Large or Large Trees remain in the Gualala, except in the South Fork, because of active timber harvest. Small diameter trees characteristic of early seral forests predominate in forested areas as a result of continuing harvest cycles. |
|
|
Changes in vegetation from 1994 to 1998 based on Landsat images from both periods are displayed at left (see Vegetation Types). These data show logging in the North Fork Gualala, lower Rockpile Creek and Buckeye Creek during this period, with more extensive cover removal showing in deeper oranges and reds. The largest patches of the most intensive changes (>70% canopy removal) are in the head waters of the Little North Fork, lower Franchini Creek and Flat Ridge Creek. |
 |
The EPA Land Cover project for the Gualala basin are depicted at left. Patterns of vegetation are similar to those derived by the USFS (see above) with the eastern and southeastern portion of the watershed showing as grasslands, shrubland and mixed forest due to Central Belt Franciscan terrain in east and Ohlsen Ranch Formation in the southwest. Patches of mixed forest and shrubland in the central and western portion of the watershed reflect early seral conditions after timber harvest. |
 |
The EPA Land Cover project is focused on urbanization as a major land use impact, although there is little development in the Gualala except at its mouth. The purple colors on the map at left show commercial and residential development in or near the town of Gualala. Only small patches of commercial/industrial show. Patches of mixed forest and shrubland in the lower Little North Fork are recent clear cuts through 1994. |
 |
This image shows USFS vegetation and stand types for the lower Big Pepperwood Creek and lower South Fork Gualala watershed with a companion photo below to see associations with vegetation types. The 1994 Landsat shows substantial components of. Non-Forest and Saplings (trees <5" diameter), mostly associated with recent timber harvest. The scale of accuracy for stands is one hectare. |
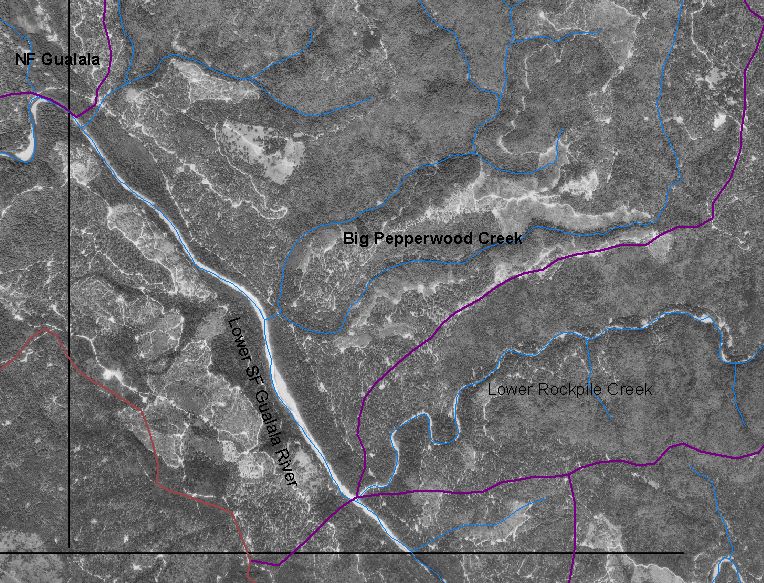 |
The
image at left is from orthophoto from the U.S. Geologic survey taken in
1996. These photos were obtained by NCWAP and compressed by the Institute
for Fisheries Resources KRIS team to be used as a backdrop in the KRIS Gualala
Map project. Note the extensive clear cut timber harvesting that matches
with early seral stage signatures on Landsat image immediately above.
|
 |
A 90-meter riparian buffer derived from a 1994 Landsat image for the South Fork Gualala basin is depicted at left. The high Non-Forest, Sapling (trees 5"diameter) and other small diameter classes is in part owing to Ohlsen Ranch Formation, which underlies the southeastern part of the South Fork Gualala basin. Conditions along the South Fork itself vary from Small Trees (5-11.9" diameter), Small/Medium (12-19.9"diameter) and Medium/Large Trees (20-29.9" diameter). The Middle South Fork Calwater has a component Very Large (>40") and Large Trees (30-39.9" diameter), which is unique in the Gualala. This could be very important in large wood recruitment and maintaining cool water in this reach. |
![]()
References
Warbington, R., B. Schwind, C. Curlis and S. Daniel. 1998. Creating a Consistent and Standardized Vegetation Database for Northwest Forest Plan Monitoring in California. USDA Forest Service. Pacific Southwest Region Remote Sensing Lab. Sacramento, CA.
![]()
| www.krisweb.com |