
| Area | Middle Klamath |
| Topic | Climate: Rainfall at Orleans 1905-1999 |
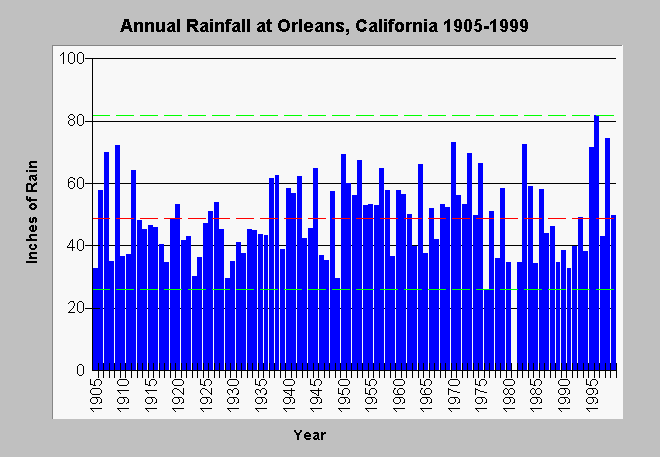
| Caption: This is the annual cumulative rainfall at Orleans, California from 1905-1999. Click on any blue bar for that year's rainfall total. The red line is average rainfall, whereas, the dashed green lines are the maximum and minimum values for all years measured. Data downloaded from the California Data Exchange Center web site. See Picture for relative location map of gauge. See Info Links for more information. | |
 |
To learn more about this topic click Info Links .
To view additional information (data source, aquisition date etc.) about this page, click Metadata .
To view the table with the chart's data, click Chart Table web page.
To download the table with the chart's data, click orlannualrain.dbf (size 3,993 bytes) .
To view the table with the chart's source data, click Source Table web page.
To download the table with the chart's source data, click orelansmorain.dbf (size 32,050 bytes)
| www.krisweb.com |