
| Area | Middle Klamath |
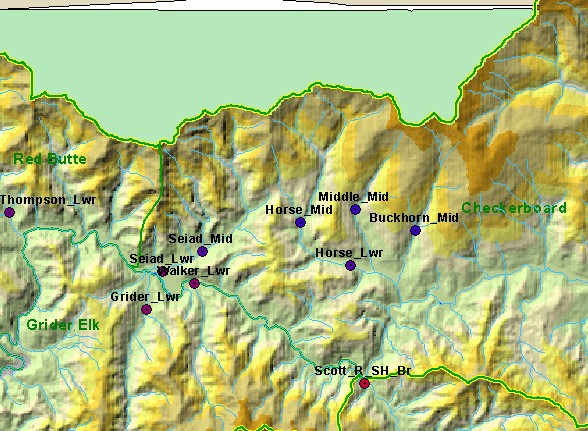
| Topic | Temperature: Floating Weekly Average, Horse Creek Sites 2002 |
| This map shows the locations of temperature monitoring stations in the western portion of the Checkerboard region of the Middle Klamath sub-basin, displayed with 1:100,000 scale perennial streams, sub-basins, and a grayscale hillshade. Stations are color-coded by maximum weekly average temperature (MWAT). Data for this 1997-2002 temperature database were contributed by Klamath National Forest and the Karuk Tribe. Scale = 1:252,849 . | |||
 |
 |
||
To view metadata about a map layer, click on a link in the table below.
| Name of Layer in Map Legend | Metadata File Name |
|---|---|
| Temperature Monitoring Pts (KNF) | temps_knf_mwats.shp.txt |
| Temperature Monitoring Pts (KNF) | temps_knf_mwats.shp.txt |
| Streams (1:100k scale)(no labels) | Unavailable |
| Middle Klamath Region (Karuk) | md_regions.shp.txt |
| Subbasins (no labels) | tfsubwsd.shp.txt |
| Waterbodies | kblak100.shp.txt |
| Elevation (meters)(USGS)(TIFF) | Unavailable |
| California | Unavailable |
| Oregon | oregon_bdry.shp.txt |
| www.krisweb.com |