
| Area | Mainstem Klamath |
| Topic | Flow: Klamath River (1) Below Iron Gate Dam 1961-2002 |
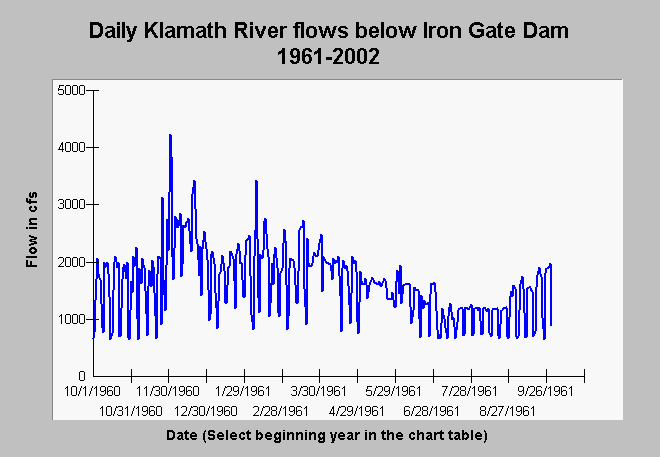
| Caption: This chart displays the hydrograph by water year for the main stem Klamath River below Iron Gate Dam taken from USGS stream gauge flow measurements, including 2002. The water year first shown above is for 1961. Note the extreme daily oscillations in flow, as much as 2500 cfs fluctuation in a 24 hour period. This represents power peaking at Copco Dams upstream which caused damage to fish life and sometimes loss of human life before Iron Gate Dam was completed. The convention for water years is to begin them on October 1 of the previous calendar year so the 1961 water year began on October 1, 1960. The period of record extends from 1961 to 2002. You may call up any water year by clicking on Chart Table, selecting the find a record tool (magnifying glass symbol), and choosing the beginning date of a water year (ie.10/1/63). Return to the Chart* and hit the green recycle button on the top, right hand corner of the screen. The Y axis of the graph may vary depending on the magnitude of the flows in any given year. | |
 |
To learn more about this topic click Info Links .
To view additional information (data source, aquisition date etc.) about this page, click Metadata .
To view the table with the chart's data, click Chart Table web page.
To download the table with the chart's data, click flow_ig_1960_2002.dbf (size 276,218 bytes) .
| www.krisweb.com |