| Area | Mainstem Klamath |
| Topic | Conductivity: Klamath River at Iron Gate, Shasta and Scott 1996 |
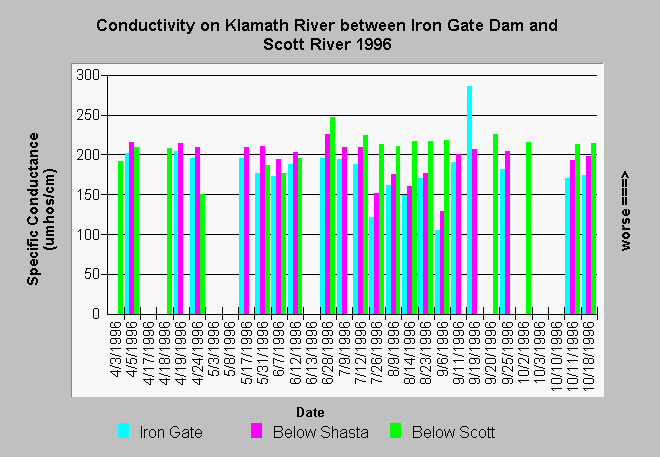
| Caption: Mainstem Klamath River conductivity at Iron Gate Dam, below the Shasta River and below the Scott River in 1996 is displayed on the chart above. The highest reading was at Iron Gate Dam in September, however, the general trend during summer was for conductivity to increase in a downstream direction. Data collected by the North Coast Regional Water Quality Control Board. See Info Links for more information. | |
 |
To learn more about this topic click Info Links .
To view additional information (data source, aquisition date etc.) about this page, click Metadata .
To view the table with the chart's data, click Chart Table web page.
To download the table with the chart's data, click mh96sco.dbf (size 18,664 bytes) .
To view the table with the chart's source data, click Source Table web page.
To download the table with the chart's source data, click mh96a.dbf (size 85,264 bytes)
| www.krisweb.com |
