| Area | Mainstem Klamath |
| Topic | Temperature: Maximum Klamath River Below Iron Gate 1992 and 1994 |
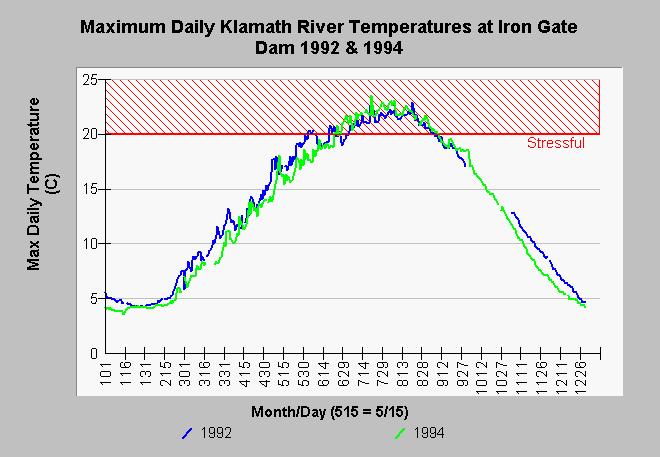
| Caption: This chart shows maximum daily water temperatures of the Klamath River as it flowed from Iron Gate Dam for the years 1992 and 1994. Temperatures exceeded stressful levels for salmonids for at least some portion of the day for from late June through early September in 1992 and 1994. Both were very dry water years which can exacerbate temperature problems. Data provided by the Karuk Tribe. See Info Links for more information. | |
 |
To learn more about this topic click Info Links .
To view additional information (data source, aquisition date etc.) about this page, click Metadata .
To view the table with the chart's data, click Chart Table web page.
To download the table with the chart's data, click mkmaxdd.dbf (size 484,692 bytes) .
To view the table with the chart's source data, click Source Table web page.
To download the table with the chart's source data, click sitetemp.dbf (size 3,124,190 bytes)
| www.krisweb.com |
