
| Area | Mainstem Trinity |
| Topic | Flow: Trinity 1964-2002 Max-Ave |
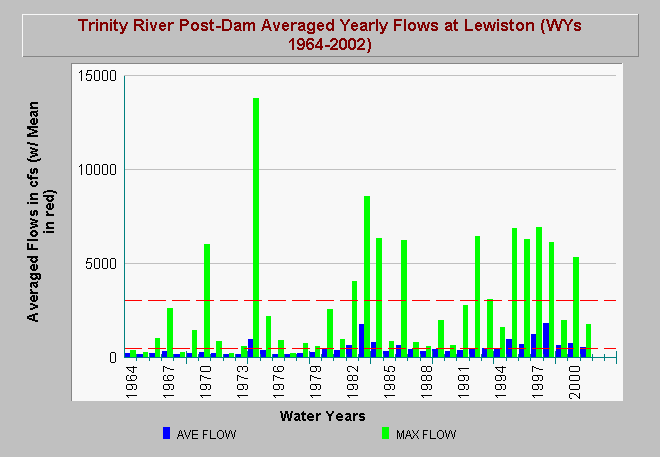
| Caption: The Chart above is constructed from USGS flow records from the Trinity River at Lewiston (USGS Station #: 11525500) for the water years 1964 (first year of dam) to 2002. The red trend line shows the mean flow level throughout this period. The flow records are average yearly flows in cubic feet per second (cfs) with water years running from October 1 (of the previous calendar year) to September 30. Data provided by the U.S. Geologic Survey. | |
 |
To learn more about this topic click Info Links .
To view additional information (data source, aquisition date etc.) about this page, click Metadata .
To view the table with the chart's data, click Chart Table web page.
To download the table with the chart's data, click lewflow1912_2002_max-ave.dbf (size 2,489 bytes) .
To view the table with the chart's source data, click Source Table web page.
To download the table with the chart's source data, click lewflow1912_2001.dbf (size 624,717 bytes)
| www.krisweb.com |