
| Area | Mainstem Trinity |
| Topic | Flow: Trinity @ Douglas City Exceedance Curve |
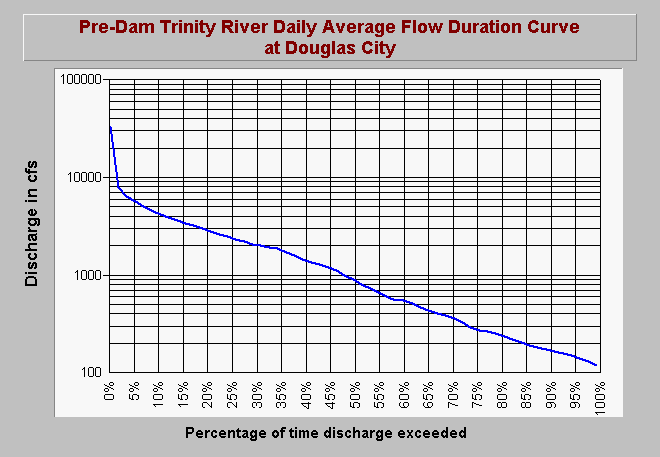
| Caption: The flow exceedance or flow duration curve shows that the Trinity River at Douglas City had a maximum flow of just over 30,000 cubic feet per second but that flows over 5,000 cfs occurred only 5% of the time prior to the construction of Trinity Dam. The flow records upon which this flow exceedance curve is based are from 1944 to 1951.This chart is patterned after treatments created by McBain and Trush to support the Trinity River flow evaluation project (see Info Links). | |
 |
To learn more about this topic click Info Links .
To view additional information (data source, aquisition date etc.) about this page, click Metadata .
To view the table with the chart's data, click Chart Table web page.
To download the table with the chart's data, click fdcdcity.dbf (size 2,136 bytes) .
| www.krisweb.com |