
| Area | Middle Trinity |
| Topic | Flow: Grass Valley Creek Exceedance Curve |
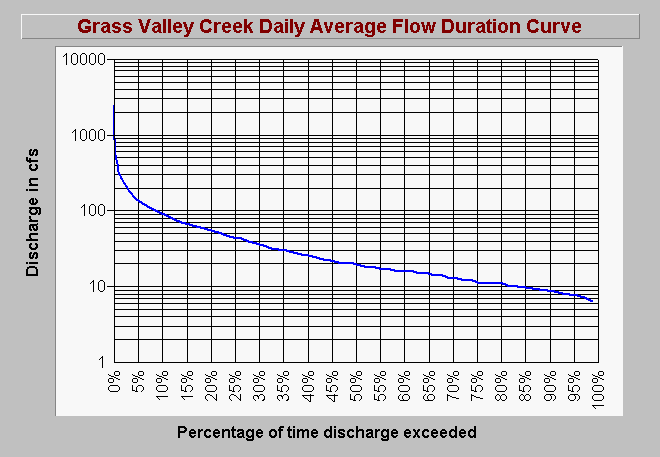
| Caption: The flow duration curve for Grass Valley Creek shows that flows exceed 100 cubic feet per second (cfs) less than 10% of the time. This chart is patterned after treatments created by Mc Bain and Trush to support the Trinity River flow evaluation project. Flow data from USGS for the periods 1/1/75 to 9/30/92 and 10/1/94 to 9/30/95. | |
 |
To learn more about this topic click Info Links .
To view additional information (data source, aquisition date etc.) about this page, click Metadata .
To view the table with the chart's data, click Chart Table web page.
To download the table with the chart's data, click fdcgvc.dbf (size 2,918 bytes) .
| www.krisweb.com |