
| Area | Middle Trinity |
| Topic | Sediment: Upper Middle Trinity - Harvest Surface Erosion through 2000 |
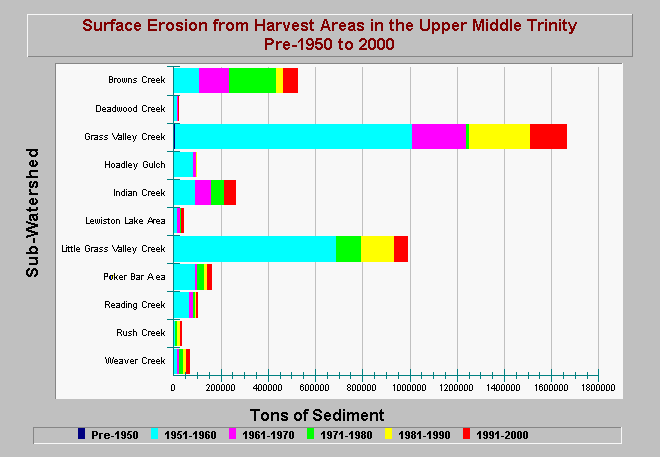
| Caption: This chart shows surface erosion (tons) by decade from harvested areas within sub-watersheds of the Upper Middle Trinity Planning Watershed. The first time period category includes data prior to 1950. The different colored bars represent tons of surface erosion per decade, while the total length of the bars show the total mass of sediment resulting from harvested areas during the period of pre-1950 to 2000. Computed amounts have decreased in each budget period since the 1950s, first reflecting lower levels of harvest on the unstable granitic terrane, and then reflecting the changes in the forest practice rules in 1974. Data are from Graham Mathews and Associates Trinity River Sediment Source Analysis (2001). See Info Links for more information. | |
 |
To learn more about this topic click Info Links .
To view additional information (data source, aquisition date etc.) about this page, click Metadata .
To view the table with the chart's data, click Chart Table web page.
To download the table with the chart's data, click timberharvest_gma_upper_middle_trinity_1940_2000.dbf (size 3,450 bytes) .
To view the table with the chart's source data, click Source Table web page.
To download the table with the chart's source data, click timberharvest_gma_trinity_1940_2000.dbf (size 17,010 bytes)
| www.krisweb.com |