| Area | Salmon River |
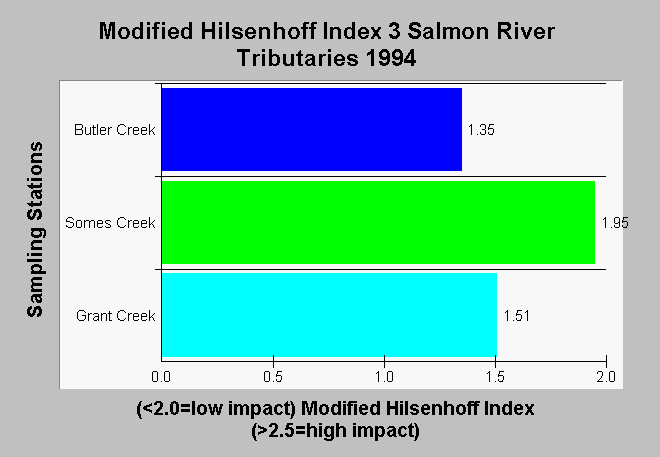
| Topic | Aquatic Inverts: Hilsenhoff Index Three Salmon River Tribs Fall 1994 |
| Caption: This index is calculated by assigning tolerance values (t-value) for all taxa (species of aquatic insects) present, multiplying the number of organisms present in each taxa by the t-value, adding all scores and then dividing by the total number of insects in the sample (EPA, 1997). Tolerance values reflect the ability of insects to withstand water pollution. Insects that can only survive in high quality water have t-values of 0-3. Those that can survive in moderate water quality have t-values of 4-6, and those that can survive in degraded water quality have t-values of 7-10. Data were collected in 1994 by students at Forks of Salmon School as part of a macroinvertebrate environmental education project. | |
 |
To learn more about this topic click Info Links .
To view additional information (data source, aquisition date etc.) about this page, click Metadata .
To view the table with the chart's data, click Chart Table web page.
To download the table with the chart's data, click metfal94.dbf (size 577 bytes) .
| www.krisweb.com |
