| Area | Scott River |
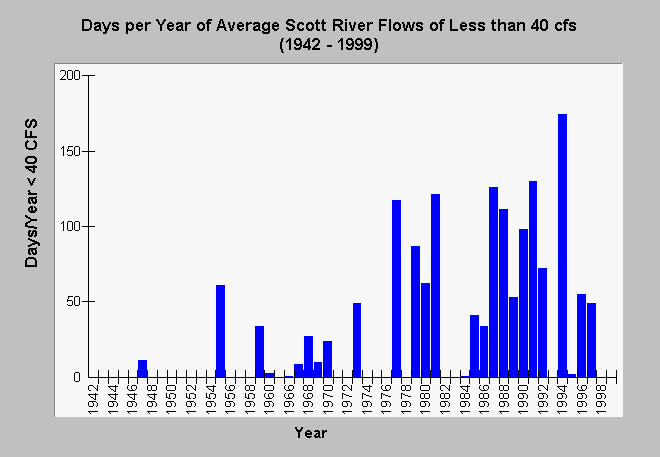
| Topic | Flow: Scott at Jones Beach Days w/ Average <40 cfs 1942-1999 |
| Caption: Days on which average flow in the Scott River, as measured by the USGS gauge below Ft. Jones, falls below 40 cubic feet per second seem to have increased substantially since 1975. Low flows reduce fish habitat available for juvenile salmon and steelhead rearing and compound problems related to high water temperatures. A lower volume of water is more subject to warming. The calculation of the number of days was calculated by Dr. Jan Derksen for the KRIS project. See Info Links for more information. | |
 |
To learn more about this topic click Info Links .
To view additional information (data source, aquisition date etc.) about this page, click Metadata .
To view the table with the chart's data, click Chart Table web page.
To download the table with the chart's data, click scfllt40.dbf (size 1,803 bytes) .
To view the table with the chart's source data, click Source Table web page.
To download the table with the chart's source data, click scavgflw.dbf (size 56,156 bytes)
| www.krisweb.com |
