| Area | S.F. Trinity |
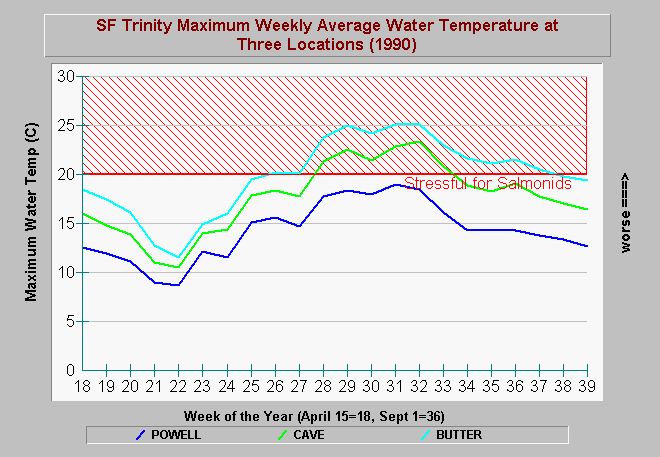
| Topic | Temperature: Maximum Weekly SF Trinity @ 3 Locations 1990 |
| Caption: The South Fork Trinity River shows progressive increases in temperature during summer in a downstream direction. While water temperatures remain below stressful levels for salmonids (20 C) in the upper South Fork, stations below Cave Creek and Butter Creek show temperatures well above the stress level. Data provided by the Shasta Trinity National Forest. See Picture for a map location of these gauges. See Info Links for more information. | |
 |
To learn more about this topic click Info Links .
To view additional information (data source, aquisition date etc.) about this page, click Metadata .
To view the table with the chart's data, click Chart Table web page.
To download the table with the chart's data, click stcelca.dbf (size 1,944 bytes) .
To view the table with the chart's source data, click Source Table web page.
To download the table with the chart's source data, click sttmp.dbf (size 141,634 bytes)
| www.krisweb.com |
