| Area | S.F. Trinity |
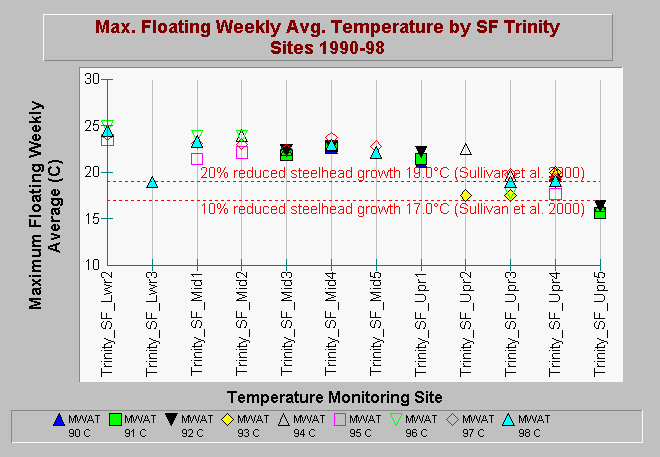
| Topic | Temperature: MWAT at Many SF Trinity Sites, by Year 1990-1998 |
| Caption: This Chart shows maximum floating weekly average temperature (MWAT) for each site in the South Fork Trinity River with available data in the years 1990-1998. Sites are grouped by stream and are listed in upstream order. The 1998 MWAT for South Fork Trinity lower site number 3 was much lower than other sites in the vicinity, partially because the temperature probe was not installed until July 25 and therefore may have missed the hottest part of the summer. Based on a review of steelhead growth studies, Sullivan et al. (2000) found that compared to optimum temperatures, an MWAT of 17.0°C reduced steelhead growth by 10%, and an MWAT of 19.0°C reduced growth by 20%. See Info Links for more information. Data were provided by the Institute for Forest and Watershed Management at Humboldt State University, which compiled a regional database from many sources. See Info Links for more information. | |
 |
To learn more about this topic click Info Links .
To view additional information (data source, aquisition date etc.) about this page, click Metadata .
To view the table with the chart's data, click Chart Table web page.
To download the table with the chart's data, click temp_mwat_st_mainstem_ifwm_90_98.dbf (size 7,957 bytes) .
To view the table with the chart's source data, click Source Table web page.
To download the table with the chart's source data, click temperature_proxy.dbf (size 80 bytes)
| www.krisweb.com |
