| Area | S.F. Trinity |
| Topic | Temperature: Floating Weekly Average SF Trinity (3) bl Cave 1991-92 |
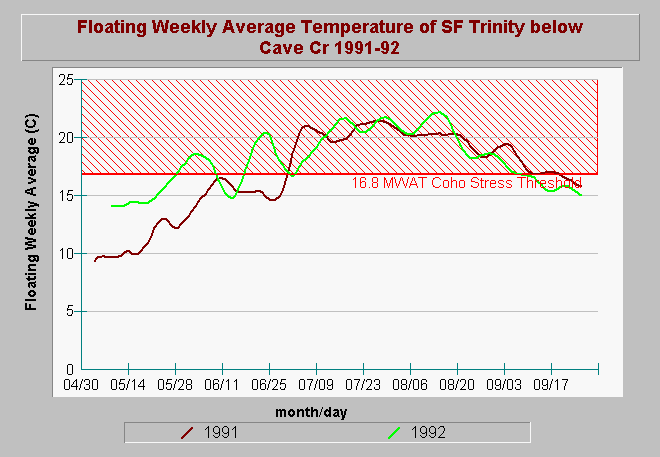
| Caption: The floating weekly average water temperature of the South Fork Trinity River below Cave Creek is shown above for the years 1991-1992. Water temperatures in the South Fork Trinity River below Cave Creek were not optimal for salmonids throughout the summer in both years. The maximum weekly average temperature (MWAT) exceeded the threshold for suitability for coho salmon according to Welsh et al. (2001). Data provided by Shasta Trinity National Forest. | |
 |
To learn more about this topic click Info Links .
To view additional information (data source, aquisition date etc.) about this page, click Metadata .
To view the table with the chart's data, click Chart Table web page.
To download the table with the chart's data, click 919295xtab.db (size 380,928 bytes) .
To view the table with the chart's source data, click Source Table web page.
To download the table with the chart's source data, click 919295.db (size 9,203,712 bytes)
| www.krisweb.com |
