
| Area | S.F. Trinity |
| Topic | Flow: SF Below Hyampom (1966-2001) |
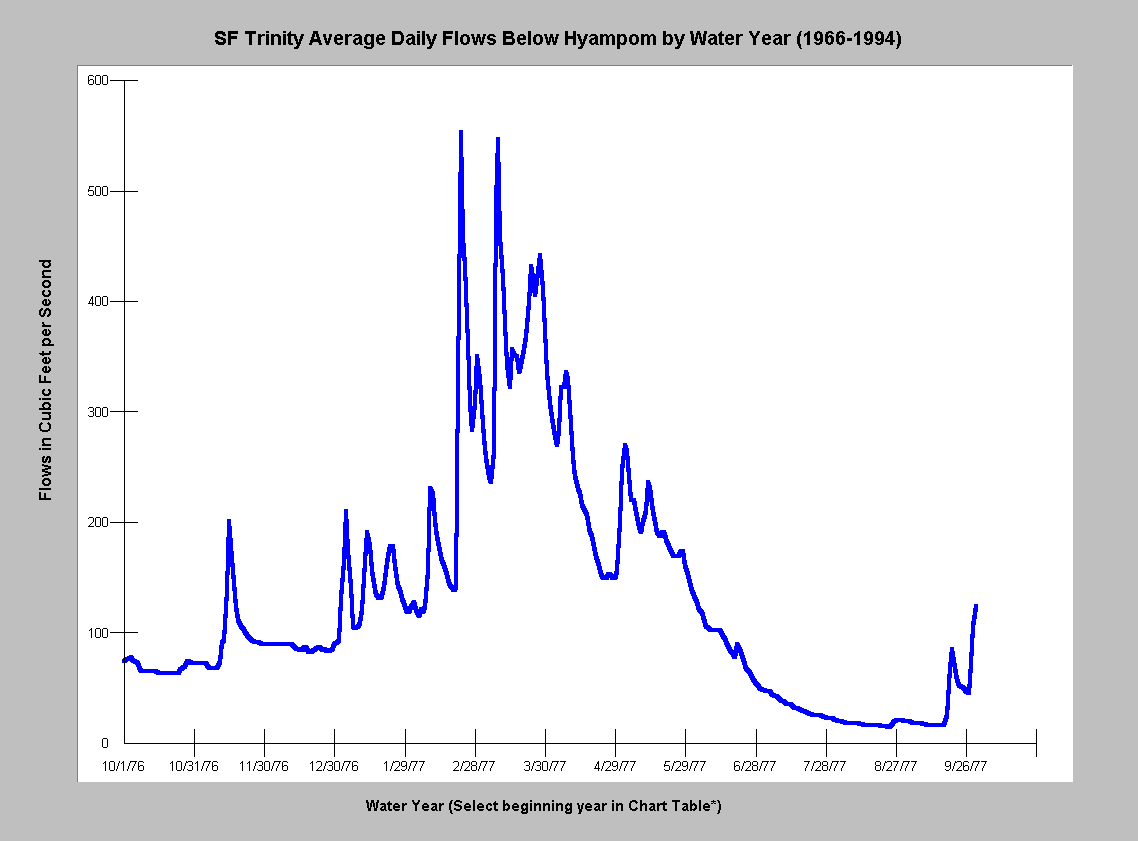
Water year 1977 shows the height of the 1976-77 drought with maximum flows of only 500 cfs. Average daily flows of the South Fork Trinity reached a low of 21 cfs. Examples of water years can be generated by going to the Chart Table and using the the search tool to pick a start date and the Chart will automatically recycle (press F1 for Help). Note major differences in Y axis values (max 600 cfs here).
Water year 1998 shows an extremely wet year with maximum flows of 15,000 cfs. Average daily flows of the South Fork Trinity reached a low of 102 cfs more than five times the drought year base flow. Examples of water years can be generated by going to the Chart Table and using the the search tool to pick a start date and the Chart will automatically recycle (press F1 for Help). Note major differences in Y axis values (max 20000 cfs here).
Water year 1997 shows an extremely wet year with maximum flows of 60,000 cfs which reflects the January 1, 1997 event. Two secondary flow peaks of 13,600 and 15,800 in December and late January are dwarfed by the New Years flood. This was not a particularly damaging flood in the SF Trinity. Examples of water years can be generated by going to the Chart Table and using the the search tool to pick a start date and the Chart will automatically recycle (press F1 for Help).Note major differences in Y axis values (max 60000 cfs here).
 Click on image to enlarge (17K).
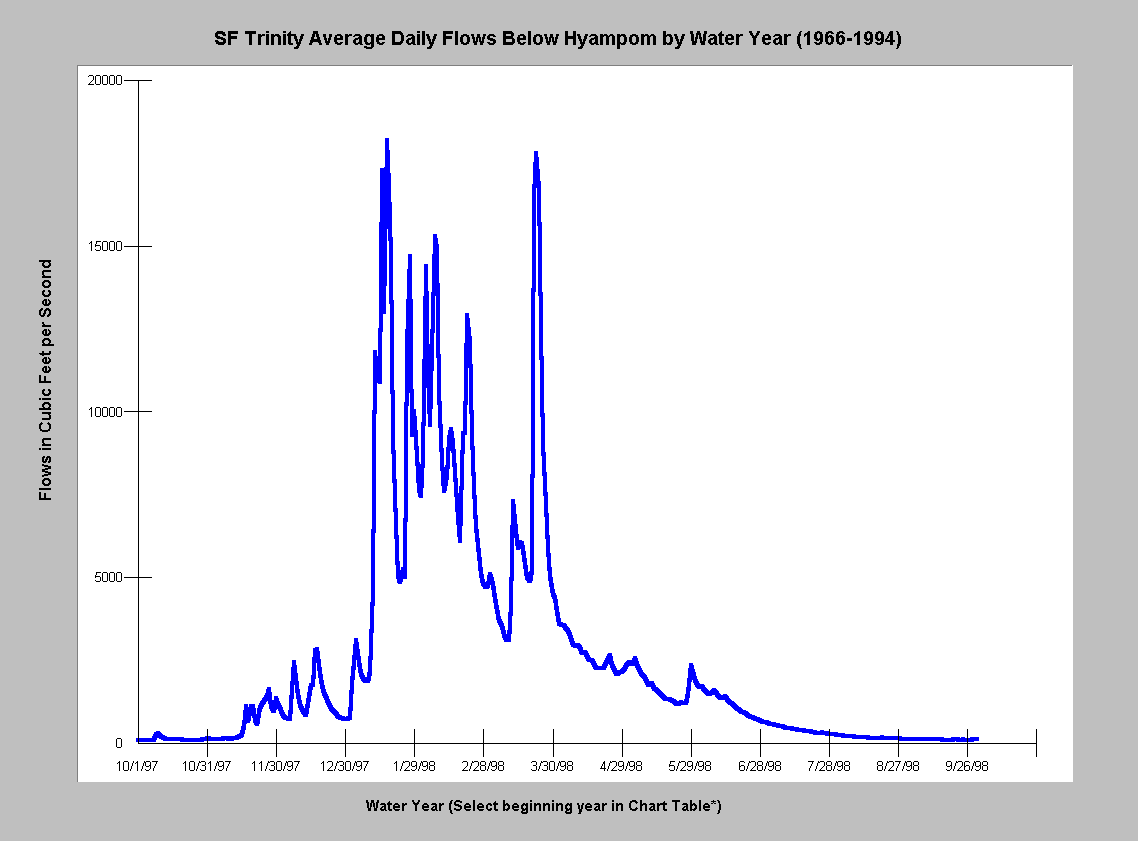 Click on image to enlarge (18K).
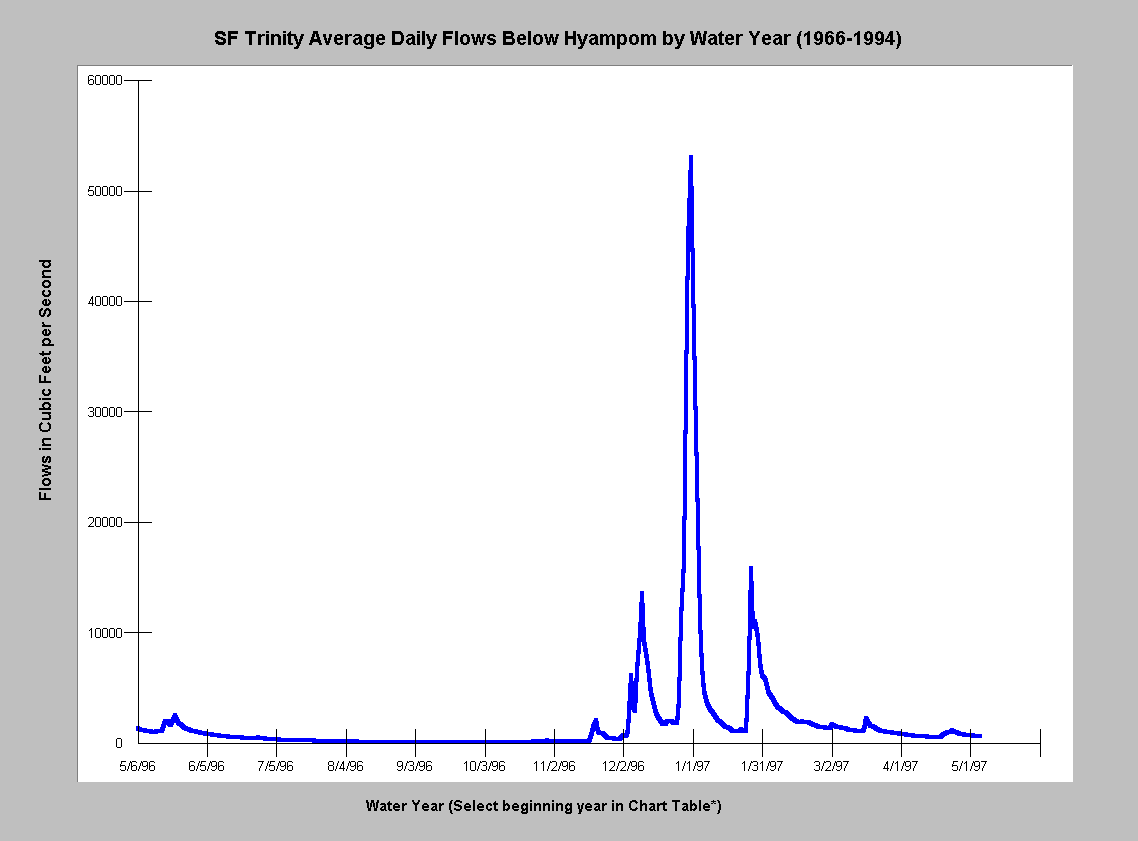 Click on image to enlarge (14K).
To learn more about this topic click Info Links
To view additional information (data source, aquisition date etc.) about this page, click Metadata
| www.krisweb.com |