 |
 |
| Background | Hypotheses| Bibliography | Maps | Home |
|
|
| Background | Hypotheses| Bibliography | Maps | Home |
MAPS: Jackson Demonstration
State Forest View
![]()
The KRIS Noyo Map JDSF view includes stream and fish data provided by the Jackson Demonstration State Forest, and by the Mendocino Redwood Company. This view also contains maps of 1986 to 1999 Timber Harvest Plans (THPs) for Ten Mile, Noyo, and Big River Basins are included. Major themes in this view include: CalWater Planning Watersheds, hydrography, stream temperature, stream order, stream gradients (change in elevation), dates and location of woody debris removal and USFS vegetation. An IFR generated theme on presence and relative abundance of coho and steelhead in the 1960s versus 1990s is also included in this view.
 143 Kb |
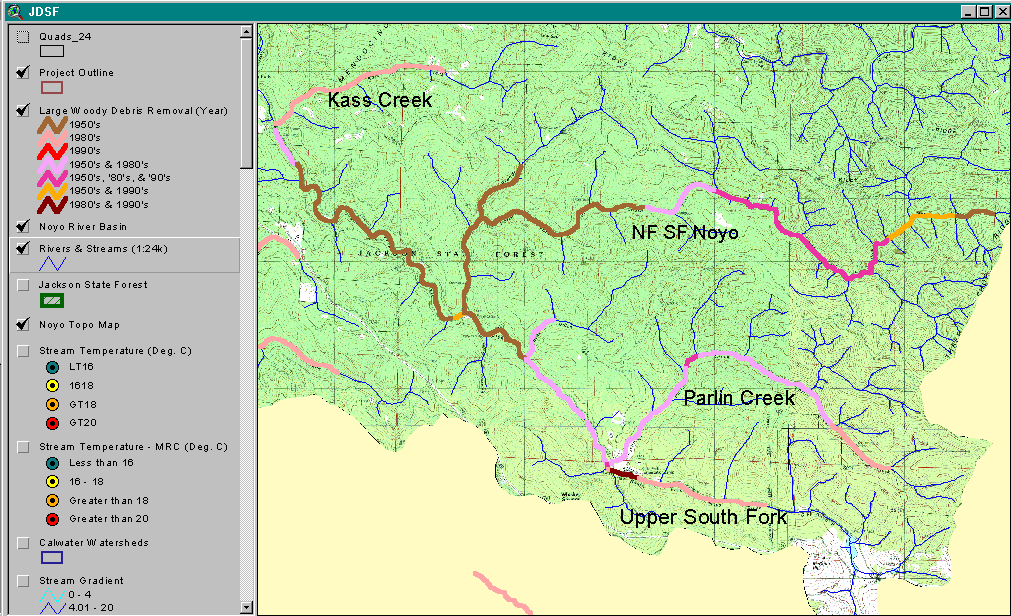
The California Department of Forestry has been compiling a very useful GIS for Jackson Demonstration State Forest. The image at left shows a theme of large wood removal by period for the South Fork Noyo basin. The backdrop is a USGS topo map. Courtesy of CDF and JDSF. |
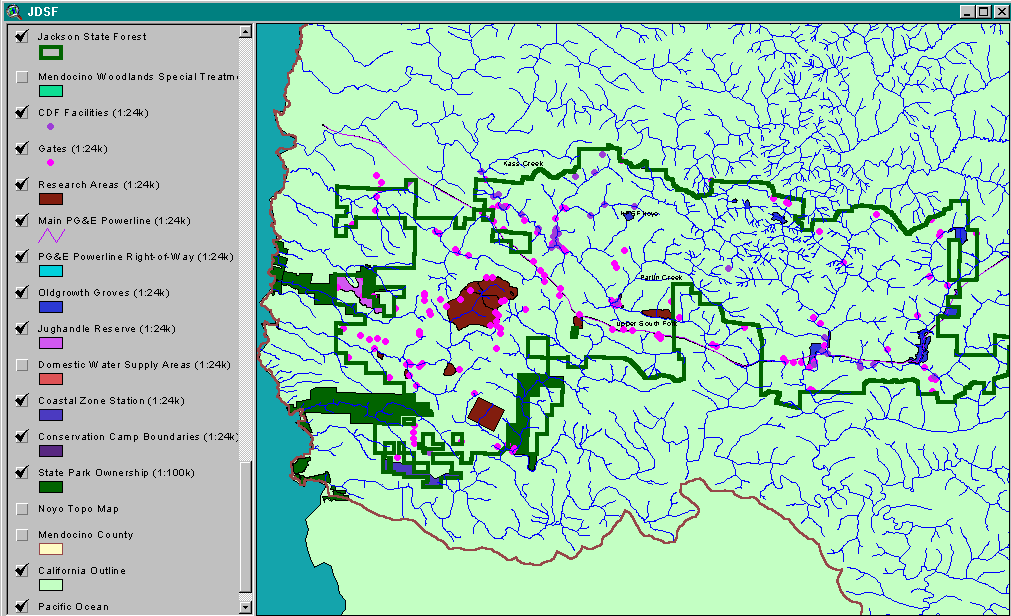 |
Jackson Demonstration State Forest offers useful layers for management and routine administration such location of facilities, jurisdictional boundaries, right of ways, gates and other necessary information. Courtesy of CDF and JDSF. |
 135 Kb |
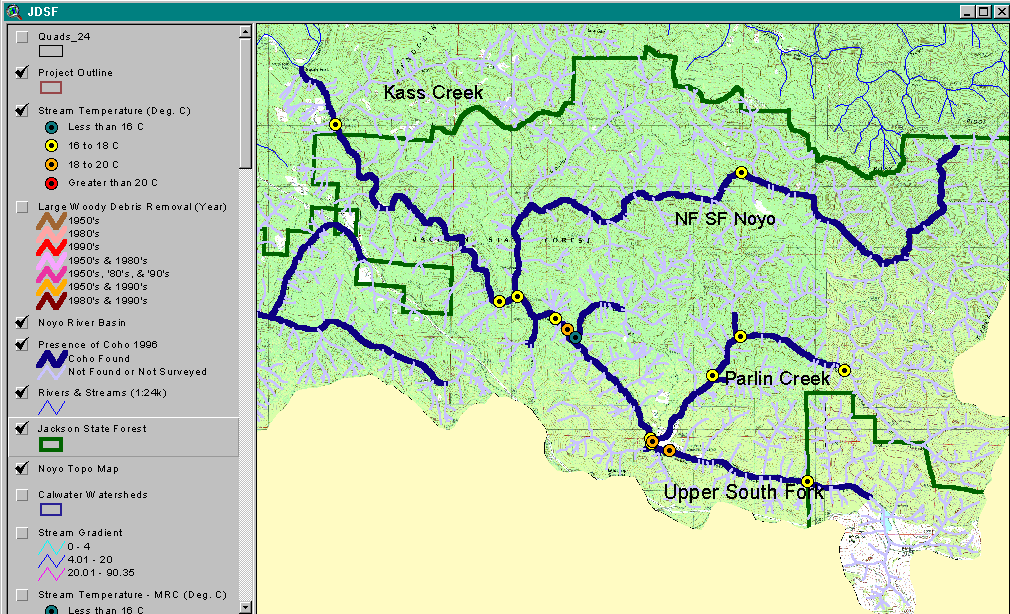
The image at left shows two themes: the known distribution of coho salmon and water temperatures at several locations in the Jackson Demonstration State Forest holdings in the South Fork Noyo basin. Many smaller streams within JDSF have not been surveyed for coho. Circles indicate the seasonal maximum temperatures in degrees Celsius. Courtesy of CDF and JDSF. |
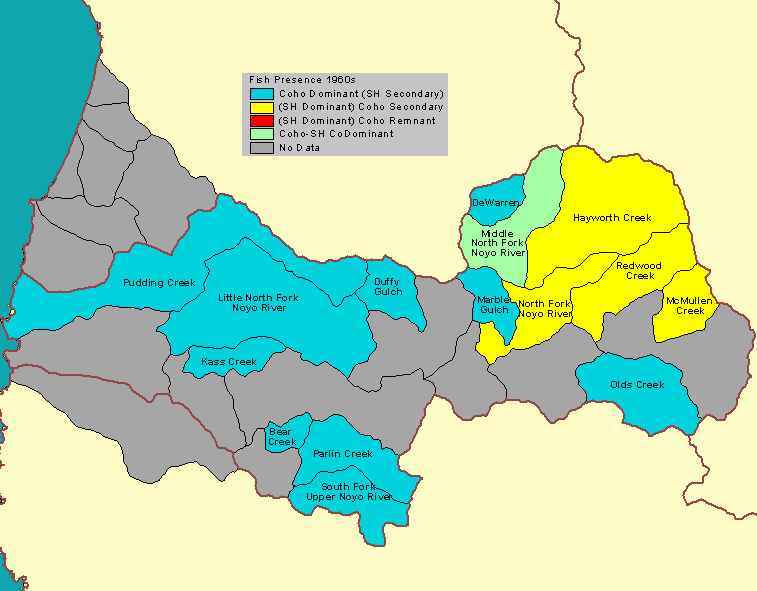 |
The fish presence theme was created by IFR to show the distribution of coho and community structure of coho and steelhead in various sub-basins in the 1960s. This map was derived using California Department of Fish and Game file memos and fish community attributes were assigned at the watershed scale. The fish presence theme for the 1990s shows a change in coho distribution. See Hypothesis #1. |
![]()
| www.krisweb.com |