| Area | Lower Noyo/Basin-wide |
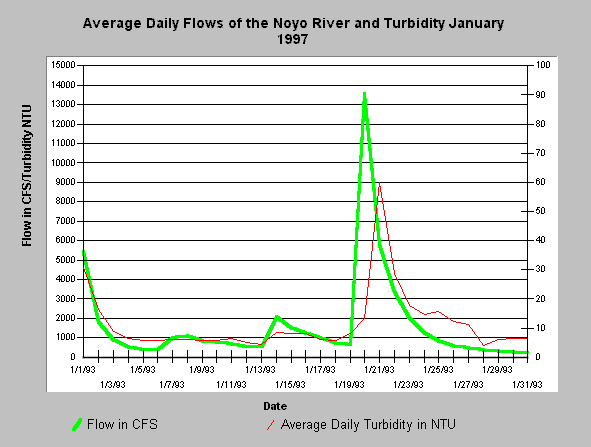
| Topic | Sediment: Turbidity vs. Flow Noyo River January 1993 |
| Caption: The chart above is derived from turbidity data collected by the city of Ft Bragg at its domestic water intake and flow data collected by USGS. The turbidity is in Nephlometric Turbidity Units (NTU). The turbidity was above 10 NTU for the first three days in January reaching a high of over 30 on New Years Day. The major storm event in the month extended from January 19-21 and turbidity ranged as high as 60 NTU and remained above 10 NTU for eight days. Taken from Matthews (1999) Sediment Source Analysis and Preliminary Sediment Budget for the Noyo River. | |
 |
To learn more about this topic click here .
To view the table with the chart's data, click Chart Table web page.
To download the table with the chart's data, click jan1993qvsntu.dbf (size 1,588 bytes) .
To see meta information about the data table used for this topic click here
| www.krisweb.com |
