
| Area | North Fork |
| Topic | Temperature: Min, Max and Average Upper Hayworth 1999 |
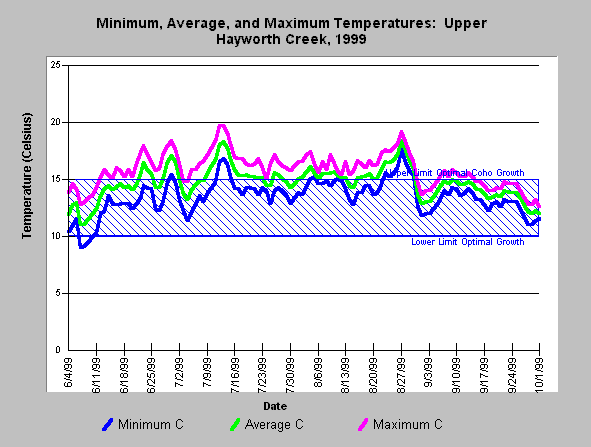
| Caption: The chart above shows the maximum, average, and minimum daily temperatures of the Upper Hayworth Creek (site 06) for 1999. Nocturnal/diurnal temperature fluctuations were as high as ~3 degrees C and seasonal fluctuations were as high as ~10.5 degrees C. The optimal water temperature for salmonid salmon growth of 10-15 degrees C (Brett, 1952) is shown for reference. Data provided by Mendocino Redwood Company. Click on Picture to see a map of temperature monitoring locations. | |
 |
To learn more about this topic click here .
To view the table with the chart's data, click Chart Table web page.
To download the table with the chart's data, click upperhaymma0699.dbf (size 8,442 bytes) .
To see meta information about the data table used for this topic click here
| www.krisweb.com |