| Area | General |
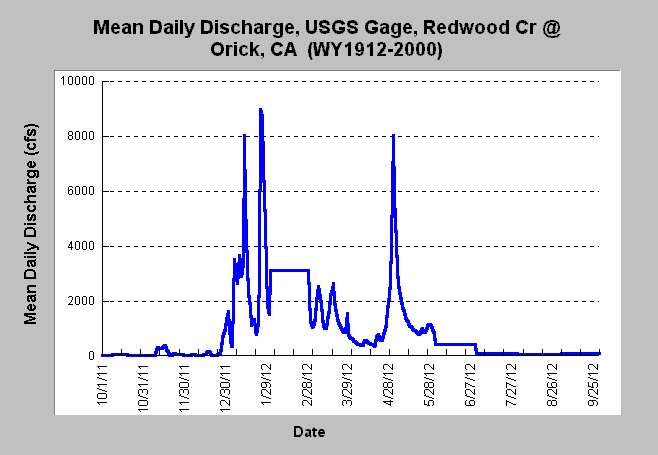
| Topic | Flow: Mean Daily Discharge, Redwood Cr @ Orick, CA WY 1912-2000 |
| Caption: The figure above displays the mean daily discharge for Redwood Creek at USGS gage 11482500 (Redwood Creek at Orick, CA) for water years 1912-2000. Change the dates displayed in the chart by toggling the slide bar located at the right of the screen. See Info Links for more information. | |
 |
To learn more about this topic click Info Links .
To view a table of information about this data click Metadata .
To view the table with the chart's data, click Chart Table web page.
To download the table with the chart's data, click discharge_redwoodnrorick_daily.dbf (size 322,262 bytes) .
| www.krisweb.com |
