
| Area | General |
| Topic | Maps of Redwood Creek Basin - Geography, Rainfall, Ownership |
This map view shows the relationship of the Redwood Creek basin to Humboldt County and the State of California. The Redwood Creek Hydrologic Unit is outlined in brown. San Francisco Bay is at the bottom of the image. This image is taken from the KRIS Redwood Creek Map project.
This map shows Redwood Creek study basins used in the Northern California Watershed Assessment Program (NCWAP). This image is taken from the KRIS Redwood Creek Map project.
Ten meter elevation data from the California Department of Forestry were used to construct this hillshade model showing elevation in the Redwood Creek basin. Elevation ranges from sea level to 5200 feet. Notice that the steeper terrain is in the upper watershed. Steeper slopes are often associated with higher erosion potential. Higher elevation areas are subject to snowfall, which may alter hydrologic response to land use because of potential changes in runoff associated with rain-on-snow events.
Although much of lower Redwood Creek and Prairie Creek are in Redwood National and State Parks, the upper Redwood Creek watershed is mostly privately owned. Small parcels of U.S. Forest Service and Bureau of Land Management can be seen in upper Redwood Creek on Board Mountain and on the eastern side in the Middle Redwood Creek sub-basin. Ownership data from Redwood National Park.
Rainfall in the Redwood Creek basin increases in steeper upper watershed areas in the headwaters, where rainfall may reach 90 inches per year. Increased rainfall is associated cooling air at higher elevations, which causes more moisture to drop from storm clouds coming in off the Pacific Ocean in winter. Rainfall on the coastal plain near Orick at the mouth of Redwood Creek is nearer 50 inches. Rainfall isopleths constructed from Oregon State University regional model. This image is taken from the KRIS Redwood Creek Map project.
This map shows the northern 11 of 22 Calwater Planning Watersheds in the Redwood Creek basin prepared by the California Department of Forestry. This image is taken from the KRIS Redwood Creek Map project.
This map of shows the Calwater Planning Watershed names for the southern Redwood Creek basin area. This image is taken from the KRIS Redwood Creek Map project.
This map of shows the USGS Quadrangle index and names for the Redwood Creek basin area. This image is taken from the KRIS Redwood Creek Map project.
 Click on image to enlarge (112K).
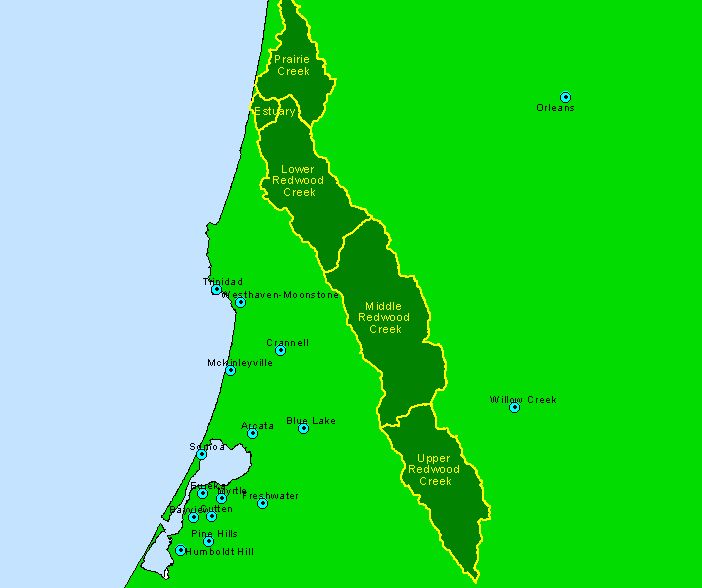 Click on image to enlarge (37K).
 Click on image to enlarge (62K).
 Click on image to enlarge (25K).
 Click on image to enlarge (32K).
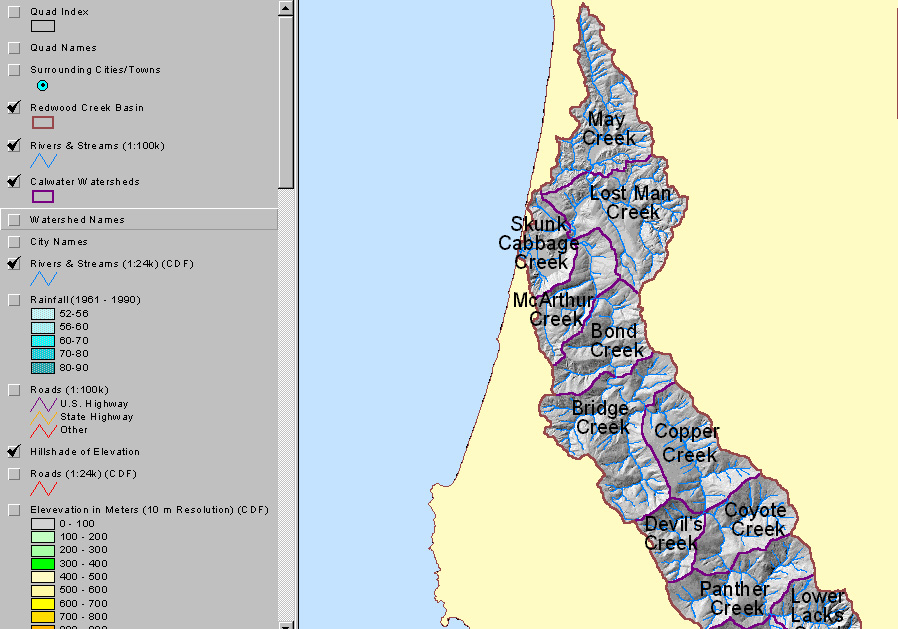 Click on image to enlarge (210K).
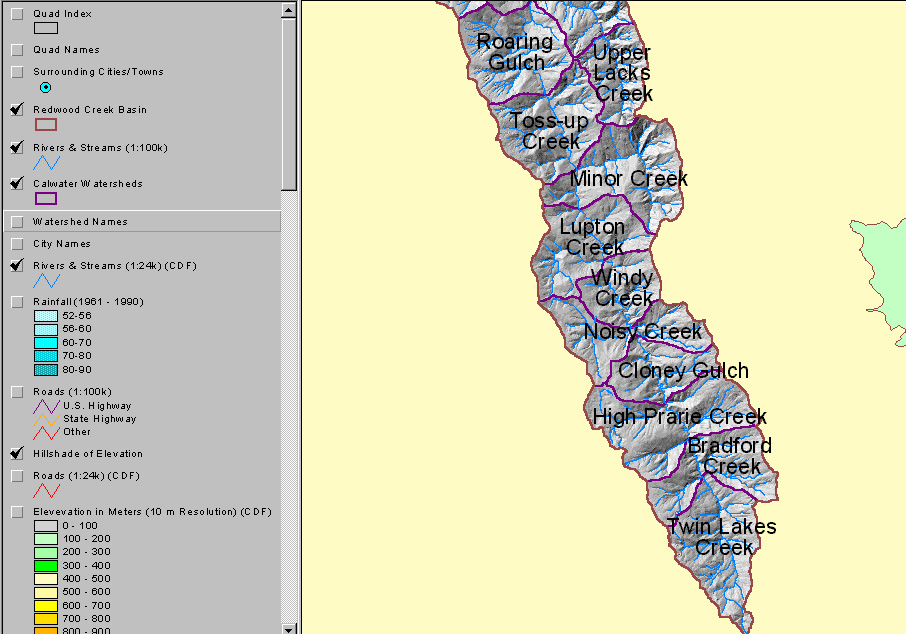 Click on image to enlarge (215K).
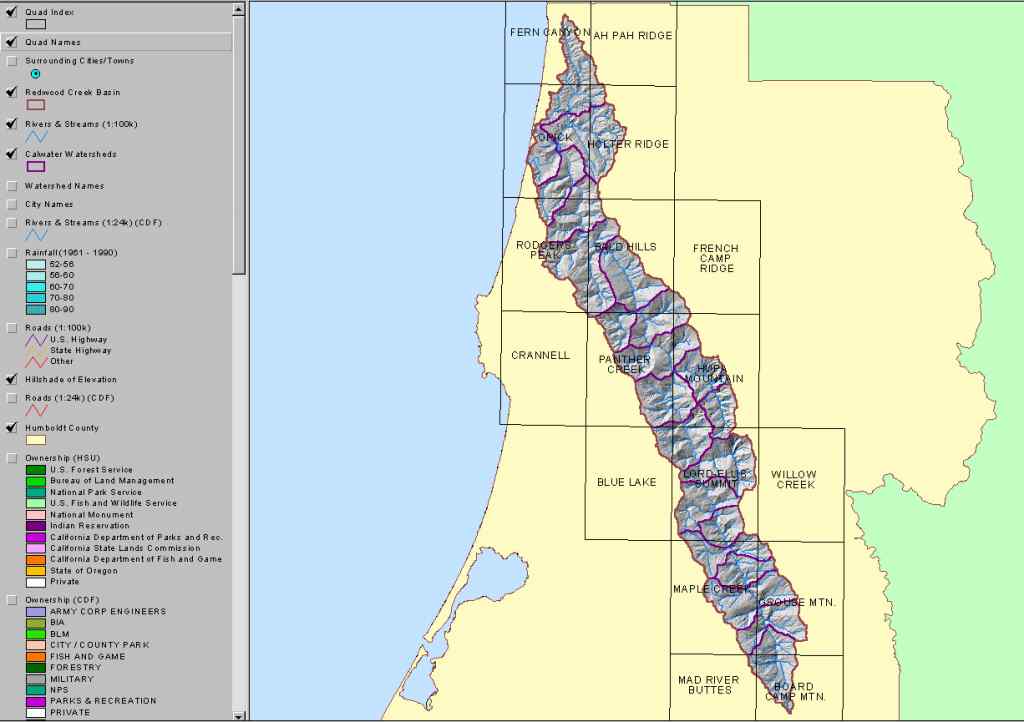 Click on image to enlarge (54K).
To learn more about this topic click Info Links
| www.krisweb.com |