
| Area | General |
| Topic | Maps of Redwood Creek Basin - THPs, SHALSTAB, Gradient, Geology |
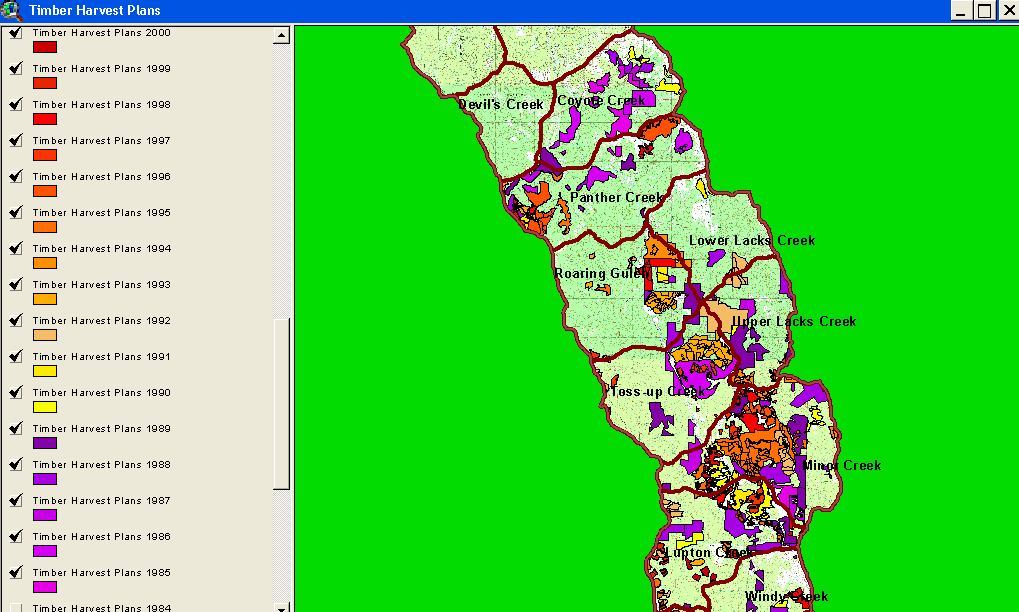
Timber harvest in Redwood Creek since 1985 were mapped by the California Department of Forestry and provided for use in the KRIS Redwood Creek Map project. Timber harvest in some areas of the Middle Redwood Creek sub-basins, such as Minor Creek, has been active in this period.
Timber harvest in Redwood Creek since 1985 were mapped by the California Department of Forestry and provided for use in the KRIS Redwood Creek Map project. Although timber harvest in the Upper Redwood Creek sub-basins, some areas of sensitive ground in the High Prairie Creek Calwater and inner gorge areas in Cloney Gulch have been disturbed by these activities.
This image shows the Shallow Landslide Stability Model (SHALSTAB) overlain on a USGS topographic map for the Middle Redwood Creek sub-basin. The relative risk of slides is high in the eastern parts of the Minor Creek and Upper and Lower Lacks Creek Calwaters. The inner gorge of Redwood Creek shows as high risk in the north part of the sub-basin as well. See the Background page on SHALSTAB for more information. Landslide information from the California Geologic Service was not made available to IFR.
This image shows the Shallow Landslide Stability Model (SHALSTAB) overlain on a USGS topographic map for the Upper Redwood Creek sub-basin. The relative risk of slides is high in the inner gorge of Redwood Creek. See the Background page on SHALSTAB for more information. Landslide information from the California Geologic Service was not made available to IFR.
The stream gradient of Redwood Creek and its tributaries in the Middle sub-basin are shown above. Note that the mainstem Redwood Creek is low gradient (<2%) and would have provided easy passage for spawning and rearing coho salmon prior to flood damage to the stream. Stream gradient data are derived from 10-meter elevation provided by CDF FRAP, which also derived the script for applying to streams. The red segments are supply reaches (>20%), where any sediment delivered to the channel is likely to be transported immediately down slope. Sections of the stream between 4% and 20% gradient are transport reaches (orange, dark purple) and response reaches are those less than 4% (lavender and dark and light blue). The latter were once the most productive spawning and rearing habitats but they are also reaches where sediment tends to remain in residence for longer periods.
The stream gradient of Redwood Creek and its tributaries in the Upper sub-basin are shown above. Note that the mainstem Redwood Creek is low gradient (<2%) and would have provided easy passage for spawning and rearing coho salmon prior to flood damage to the stream up to the Bradford Creek Calwater. Stream gradient data are derived from 10-meter elevation provided by CDF FRAP, which also derived the script for applying to streams. The red segments are supply reaches (>20%), where any sediment delivered to the channel is likely to be transported immediately down slope. Sections of the stream between 4% and 20% gradient are transport reaches (orange, dark purple) and response reaches are those less than 4% (lavender and dark and light blue). The latter were once the most productive spawning and rearing habitats but they are also reaches where sediment tends to remain in residence for longer periods.
At left is the geologic map for Redwood Creek zoomed in on the Upper sub-basin. The distinct line between geologic units is the course of Redwood Creek and the trace of the Grogan Fault, which is a product of crust compression to the west of the Cascadia Subduction Zone. Redwood Creek is one of several north coast streams that follow earthquake faults. Almost all the rock types shown in this image are weakly consolidated and highly sheared in places. The numerous landslide deposits shown on the map corroborate the elevated erosion risk associated with some units, such as the Incoherent Lacks Creek and South Fork Mountain Schist formations. This map is from the U.S. Geologic Service and is in the KRIS Redwood Creek Map project.
This map of the Lower and Middle Redwood Creek sub-basins shows the Redwood Creek following the contact of the Grogan Fault, with Grogan Sandstones and Mudstones on the west of the fault and weakly consolidated Lacks Creek formation making up much of the land on the east side of the fault. Note numerous landslide deposits on the east side of the fault. See the Geology Background page for more information. This map is from the U.S. Geologic Service and is in the KRIS Redwood Creek Map project.
 Click on image to enlarge (62K).
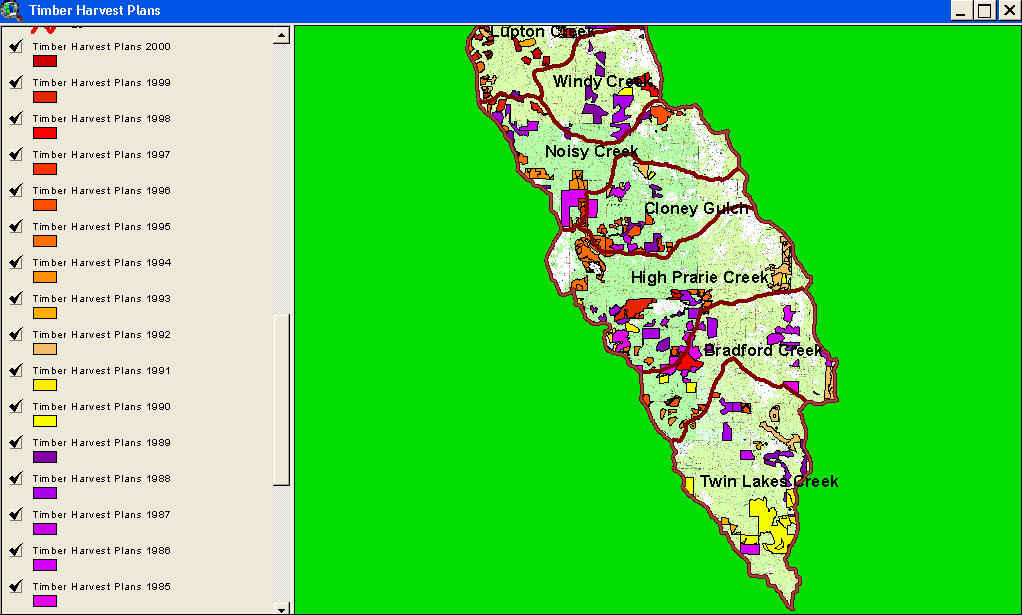 Click on image to enlarge (53K).
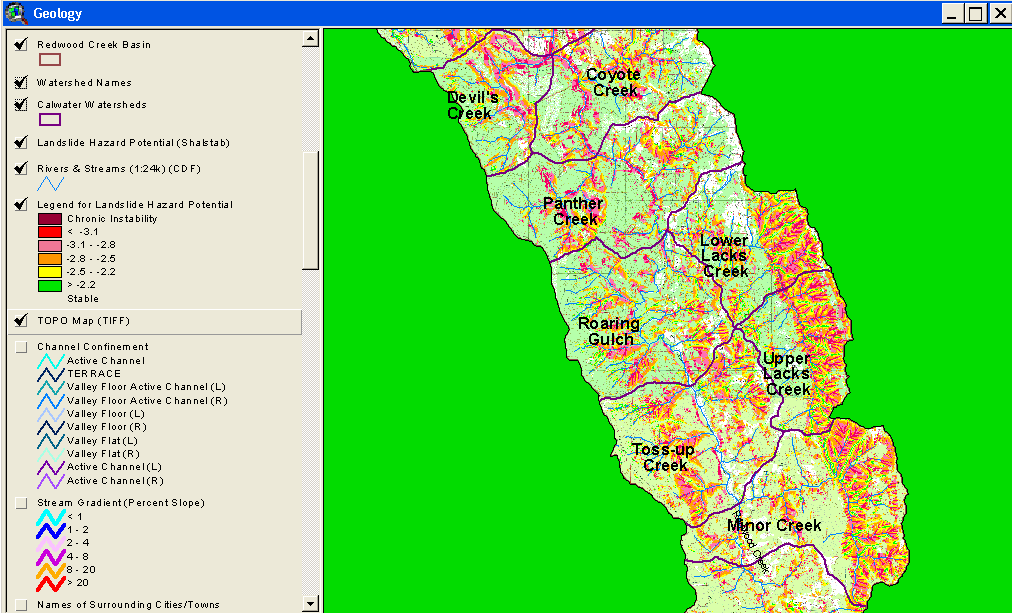 Click on image to enlarge (89K).
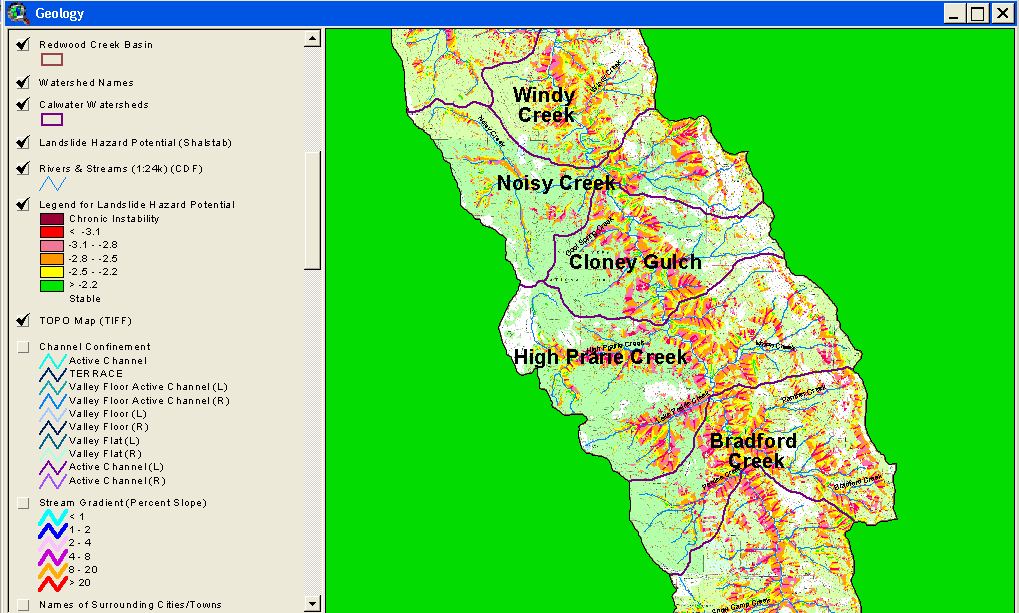 Click on image to enlarge (87K).
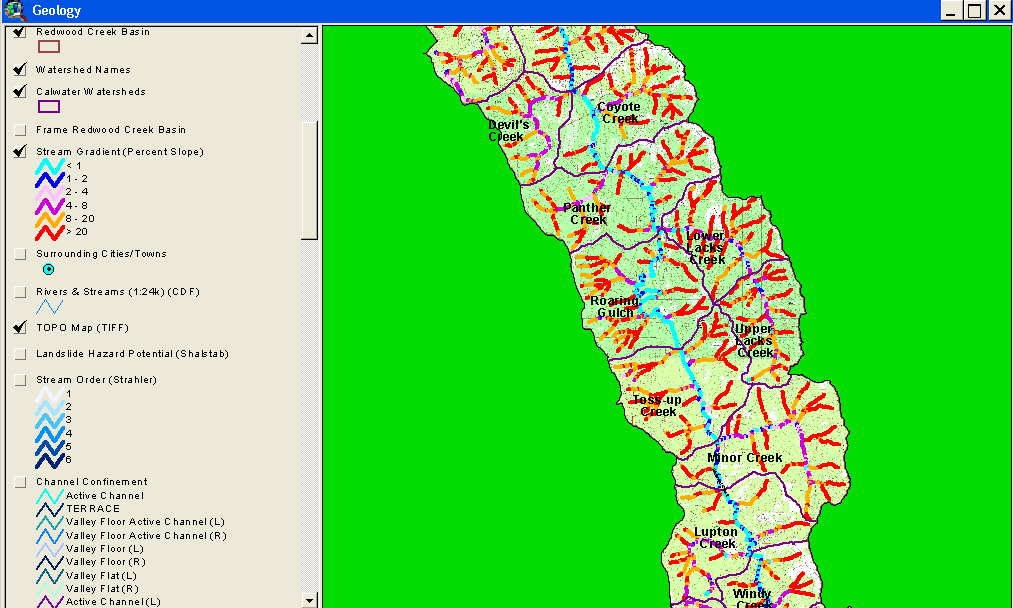 Click on image to enlarge (62K).
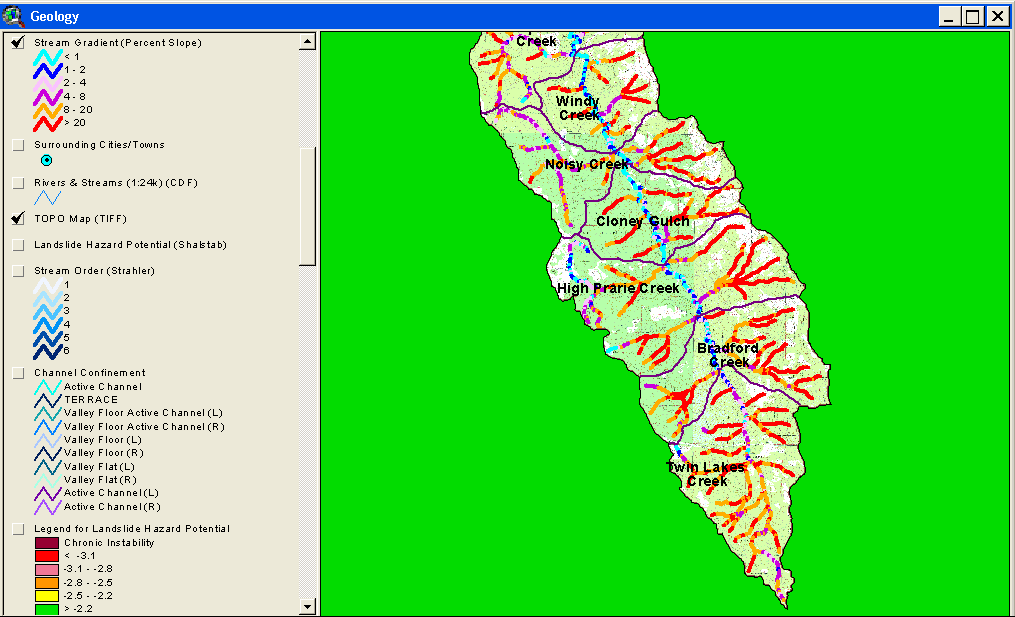 Click on image to enlarge (53K).
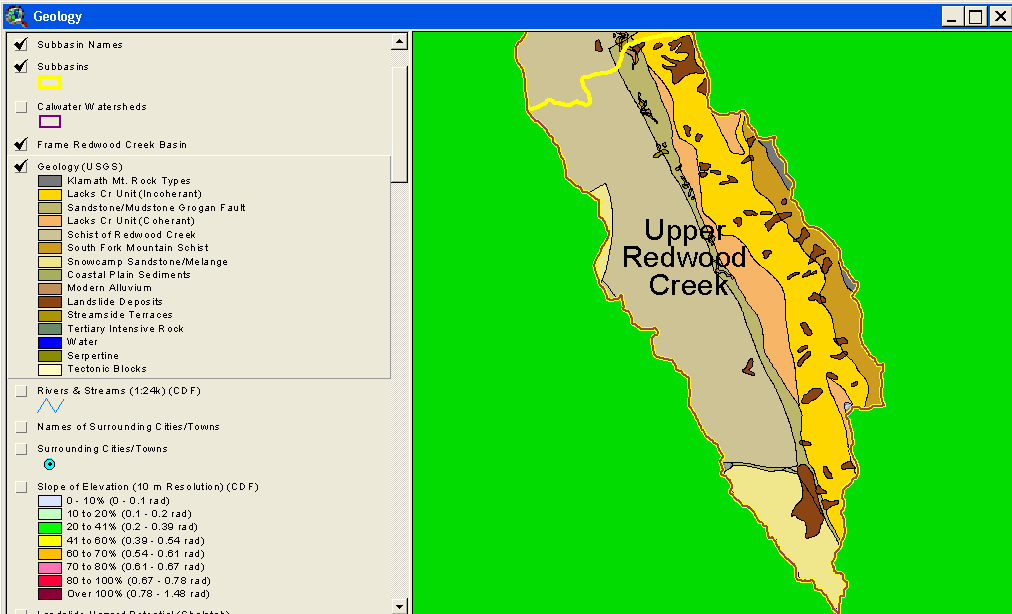 Click on image to enlarge (31K).
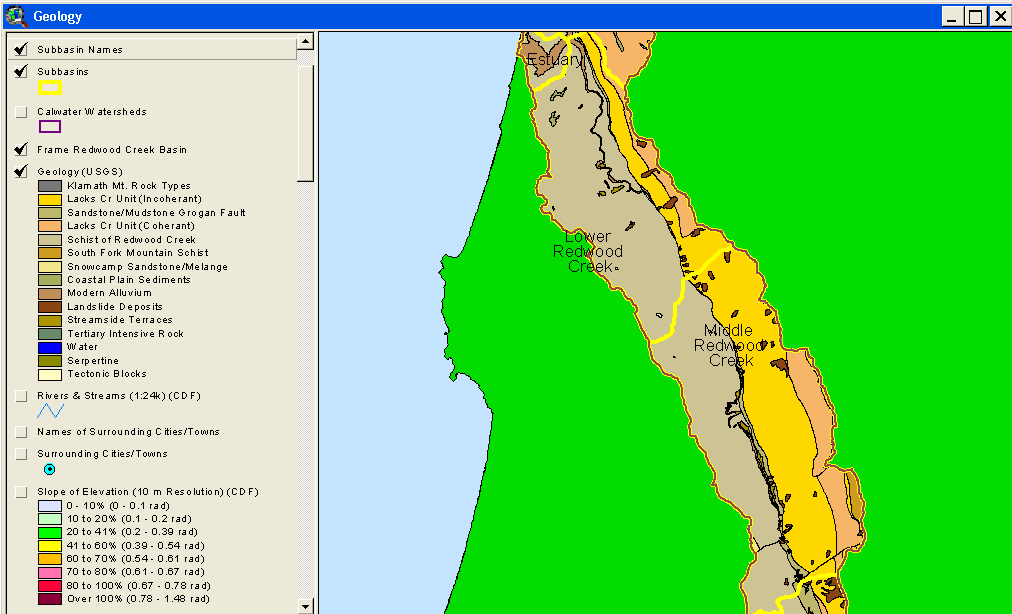 Click on image to enlarge (31K).
To learn more about this topic click Info Links
| www.krisweb.com |