
| Area | Prairie Creek |
| Topic | Sediment: V* From Lost Man Creek, 1992-1993 |
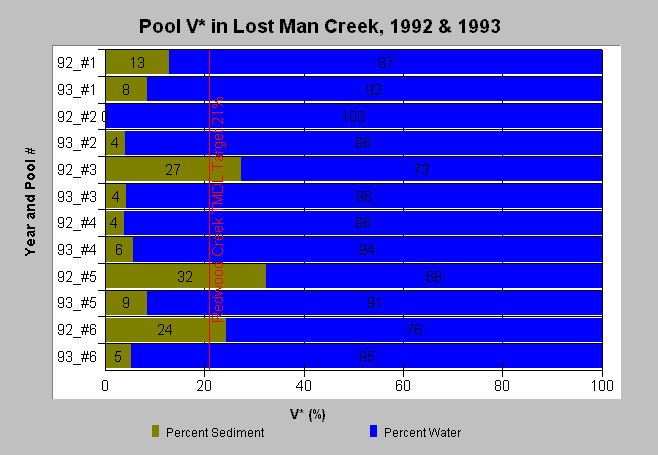
| Caption: This chart illustrates that the V* in Lost Man Creek measured in 1992 and 1993 is low. The Y-axis shows year and pool number while the X-axis shows the proportion of the residual pool filled with fine sediment. 1992 values are from Knopp and 1993 values are from a master's thesis (Lydgate, unpublished). A V* of 50% indicates that half of the pool is filled with fine sediment. Data provided by the North Coast Regional Water Quality Control Board. See Info Links for more information. Click on the Picture Tab to see the sampling locations and a map of roads in the basin. | |
 |
To learn more about this topic click Info Links .
To view a table of information about this data click Metadata .
To view the table with the chart's data, click Chart Table web page.
To download the table with the chart's data, click vstar_big_lost_man.dbf (size 1,858 bytes) .
To view the table with the chart's source data, click Source Table web page.
To download the table with the chart's source data, click knopp.dbf (size 12,582 bytes)
| www.krisweb.com |