
| Area | Prairie Creek |
| Topic | Temperature: Floating Weekly Average, Prairie Creek at Wolf Bridge |
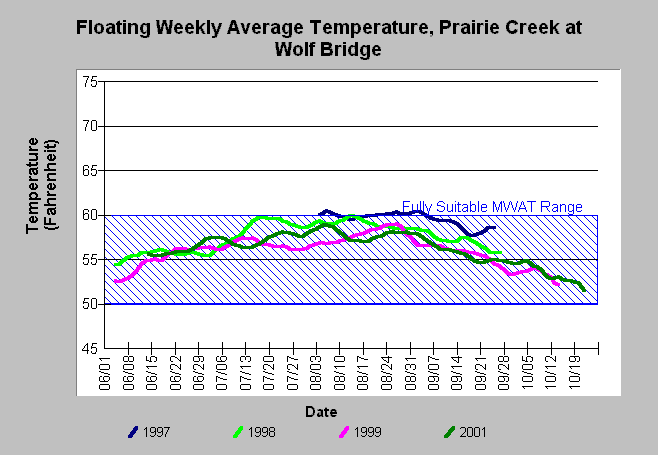
| Caption: The graph above shows floating weekly average water temperature in Prairie Creek at Wolf Bridge for 1997-1999 and 2001. The maximum floating weekly average temperatures (MWAT) lay within optimal levels (50-60 F). Data provided by Redwood National Park. Click on Info Links for more information. | |
 |
To learn more about this topic click Info Links .
To view a table of information about this data click Metadata .
To view the table with the chart's data, click Chart Table web page.
To download the table with the chart's data, click tempf_daily_rc_pc.db (size 53,248 bytes) .
To view the table with the chart's source data, click Source Table web page.
To download the table with the chart's source data, click allrawtemps.dbf (size 11,463,373 bytes)
| www.krisweb.com |