| Area | Upper Redwood |
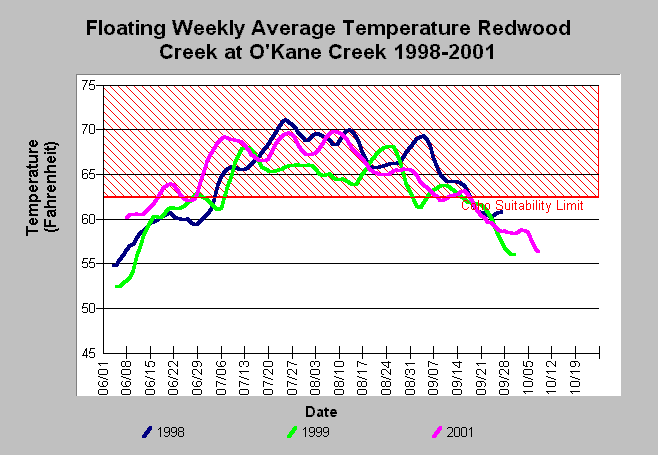
| Topic | Temperature: Floating Weekly Average, Redwood Cr at O'Kane Cr 1998-01 |
| Caption: The graph above shows floating weekly average water temperature for Redwood Creek at the O'Kane confluence in 1998, 1999, and 2001. The maximum floating weekly average temperature (MWAT) exceeded the coho suitability limit, 62.4 F (REF), during July through mid-September in all years. Data provided by Redwood National Park. Click on Info Links for more information. | |
 |
To learn more about this topic click Info Links .
To view a table of information about this data click Metadata .
To view the table with the chart's data, click Chart Table web page.
To download the table with the chart's data, click tempf_daily_rc_ur.db (size 79,872 bytes) .
To view the table with the chart's source data, click Source Table web page.
To download the table with the chart's source data, click allrawtemps.dbf (size 11,463,373 bytes)
| www.krisweb.com |
