 |
 |
| Background | Hypotheses | Bibliography | Maps | Home |
 |
 |
| Background | Hypotheses | Bibliography | Maps | Home |
KRIS Web Background Pages: Fish Populations
![]()
Fisheries data in KRIS Ten Mile come from the Hawthorne Timber Company (HTC), the California Department of Fish and Game (CDFG) and the Salmon Restoration Association (Maahs, 1990; 1992; 1996; 1997; 1999). Mangelsdorf and Clyde (2000) also provide some useful discussions of Ten Mile River fisheries resources. Information about hatchery supplementation can be found in the Hatchery Information in KRIS Ten Mile background page.
CDFG Ten Mile River basin surveys done during the 1960s are less detailed than surveys for the nearby Noyo River. No fish sampling was done, but recorded streamside observations provide information on distribution of coho and their abundance relative to steelhead. Twenty-eight CDFG reports for various tributaries are in the Ten Mile section of the KRIS Bibliography. CDFG electrofishing data collected by Weldon Jones and Scott Harris are available for some Ten Mile River basin streams. CDFG downstream migrant trapping data for Wages Creek are in the KRIS Ten Mile project because this stream is within Coastal Tribs North sub basin.
Hawthorne Timber Company fisheries information included in KRIS Ten Mile spans from 1993 to 2000. Data come from 24 sites throughout the Ten Mile River watershed, where fish were collected using multiple-pass electrofishing. Sampling took place in representative reaches of the mainstem and tributaries, in proximity to temperature monitoring stations. Data collected during the surveys include habitat area, number of vertebrates captured by species, and species biomass per site. KRIS charts show HTC electrofishing data for each site as either a time-series (1993-2000) or as total catch by species per year. See Amphibian Data in KRIS Ten Mile for information on frogs and salamanders.
Data from Maahs (various years) includes carcass and redd counts and downstream migrant trapping. While the carcass and redd counts provide only snapshots, downstream migrant data give a very good idea of fish community structure, juvenile life history and size at the time of capture.
 |
An extensive survey of all potential coho salmon rearing streams in the Ten Mile basin in the summer of 2000 revealed presence in 6 of 28 streams and a total estimated population of 1731 juvenile coho. Two snorkelers covered over 30 miles of stream, and results confirm distribution of coho as indicated by electrofishing at monitoring sites. Only the Little North Fork Ten Mile and Bear Haven Creek appeared to be producing more than incidental numbers of coho. Data from HTC. |
 |
The chart at left shows the mean density for juvenile coho salmon and steelhead trout from 24 electrofishing stations throughout the Ten Mile River Watershed from 1993 to 2000. Note that there are two axes and that steelhead density was at least 10 times greater than coho density in every year. The highest coho juvenile densities by far were found in 1996 following an adult return estimated at 190-250 fish. The other years coho densities were roughly one fifth or less of 1996 levels indicating significantly lower adult returns in previous spawning years or low survival rates for juveniles (see Hypothesis #1). Data provided by HTC. |
Downstream migrant traps provide a much better sampling method for gauging fish community structure. Traps are operated for several months and fish are measured as they are counted. Data reveal migration timing, size, age and species composition. The traps in the South Fork Ten Mile River and its tributaries do not capture the entire stream flow and have not been calibrated to allow extrapolation and calculation of populations. Sampling methods are described in Maahs (1996).
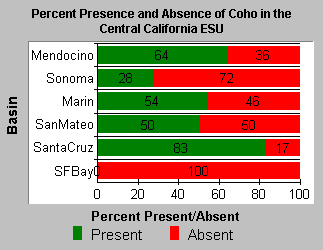
The charts below show the findings of field surveys to determine the presence or absence of juvenile coho salmon in streams throughout the Central California ESU, which extends south of the Mattole River to Santa Cruz, including some San Francisco Bay tributaries. The loss of coho salmon from tributary basins and portions of large rivers indicates fragmentation of the coho distribution, which is a warning sign for decline toward extinction. Noyo River and Ten Mile River presence data may have been influenced by hatchery operation. Absence data is provisional pending more extensive study because streams have not been surveyed in three consecutive years and when year classes fail, coho may be present in some years but not others.
 |
 |
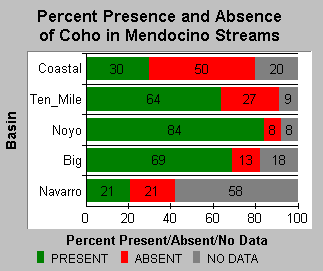
| In Mendocino County, 36% of the streams lacked coho, while coho were absent from 72% of Sonoma streams. Absence data is provisional pending more extensive study because coho may exist in some streams but only occur in some years while other year classes have been completely lost. Data are from Adams et. al.(1999). | The chart above shows the presence or absence of juvenile coho salmon in Mendocino coastal streams in the early 1990s as presented in Brown et al. (1994). Coho were missing from 50% of the small tributaries that drain directly to the Pacific Ocean (Coastal), 27% of Ten Mile River tributaries surveyed, 8% of Noyo River tributaries and 21% of Navarro River tributaries. Tributaries known to harbor coho in the past but not surveyed are shown as NO DATA above. |
![]()
References
(See KRIS Bibliography for CDFG Ten Mile references)
Adams, P.B., M.J. Bowers, H.E. Fish, T.E. Laidig, and K.R. Silberberg. 1999. Historical and Current Presence-Absence of Coho Salmon (Oncorhynchus kisutch) in the Central California Coast Evolutionarily Significant Unit. National Marine Fisheries Service, Southwest Fisheries Science Center. Administrative Report SC-99-02. 24 pp.
Burns, J. 1972. Some Effects of Logging and Associated Road Construction on Northern California Streams. Transactions of the American Fisheries Society, Vol. 101, No.1: 1-17.
Brown, L.R., P.B. Moyle, and R.M. Yoshiyama. 1994. Historical Decline and Current Status of Coho Salmon in California. North American Journal of Fisheries Management. 14(2):237-261.
Maahs, M. 1999. Fort Bragg's World's Biggest Salmon BBQ: a brief history of the Salmon Restoration Association and their work. Salmon Restoration Association. Fort Bragg, CA.
Maahs, M. 1997. 1997 Outmigrant trapping, coho relocation and sculpin predation survey of the South Fork Ten Mile River. Prepared for Humboldt County Resource Conservation District. Salmon Trollers Marketing Association, Inc. Fort Bragg, CA. 37 pp. without appendices.
Maahs, M. 1996. 1996 South Fork Ten Mile River and Little North Fork Noyo Outmigrant Trapping. Final Report for Humboldt County Resources Conservation District. 43 pp.
Maahs, M. 1992. Ten Mile River habitat and fishery evaluation survey. Salmon Restoration Association. Fort Bragg, CA. 15 pp.
Maahs, M. Unpublished(a). A salmon spawning survey for portions of Ten Mile, Caspar Creek and Garcia River. 1995-96. Prepared for Humboldt County Resource Conservation District. Salmon Trollers Marketing Association, Inc. Fort Bragg, CA. 31 pp.
Maahs, M. Unpublished(b). The 1996-97 salmonid spawning survey for portions of the Ten Mile River, Garcia River and Caspar Creek. Prepared for Humboldt County Resource Conservation District. Salmon Trollers Marketing Association, Inc. Fort Bragg, CA. 31 pp.
Mangelsdorf, A. and L. Clyde. 2000. Draft (through Chapter 4-Ten Mile River). Assessment of aquatic conditions in the Mendocino Coast Hydrologic Unit. California Regional Water Resources Control Board. North Coast Region. Santa Rosa, CA. 120 pp.
Manning, D.J. 2000. Carrying Capacity and Limiting Habitat Analysis for Coho Salmon (Oncorhynchus kisutch) in Streams of Northwestern California. Masters Thesis, Humboldt State University, Arcata, CA. 111p.
Salmon Trollers Marketing Association, Inc. Undated. Preliminary report for February 1990 - Georgia-Pacific Property, carcass surveys. 4 pp.
![]()
| www.krisweb.com |